Data Analysis with Excel

Data Model in Excel (A Complete Guide)

In this article, we will discuss and show how you can use and create a data model in Excel. We will go through some easy techniques to do the task. ...

Create Relationships in Excel (3 Effective Ways)

In this Excel tutorial, you will learn how to create relationships. In the first method, we will use PivotTable to create relationships between ...

Quick Analysis Tool in Excel (Open and Use)

In this article, we will show you the different features of the Quick Analysis Tool in Excel. There are 5 core features of the Quick Analysis Tool. ...

How to Add Tags in Excel?

In this article, you will learn how to - Merge IF, SEARCH, and ISNUMBER functions to add tags in Excel - Use the Excel Filter option to add tags ...

Rearranging in Excel

Rearranging in Excel: Knowledge Hub How to Rearrange Columns Alphabetically in Excel How to Automatically Rearrange Columns in Excel How ...

Organize Data in Excel: A Complete Guide

In this Excel tutorial, we have discussed how to -Organize data using Sort feature. -Apply Filter feature to organize data. -Highlight important ...

Data Analysis in Excel (A Comprehensive Guideline)

In this article, we will learn how to analyze data in Excel. To start, we will explore different Excel functions, such as VLOOKUP, INDEX-MATCH, ...

Data Table in Excel (Create, Edit, and Delete)

In this article, we’ll learn how to create, edit, and delete a data table in Excel. Creating a data table in Excel is an important feature of ...

How to Perform Excel Data Analysis: Forecasting (3 Easy Ways)

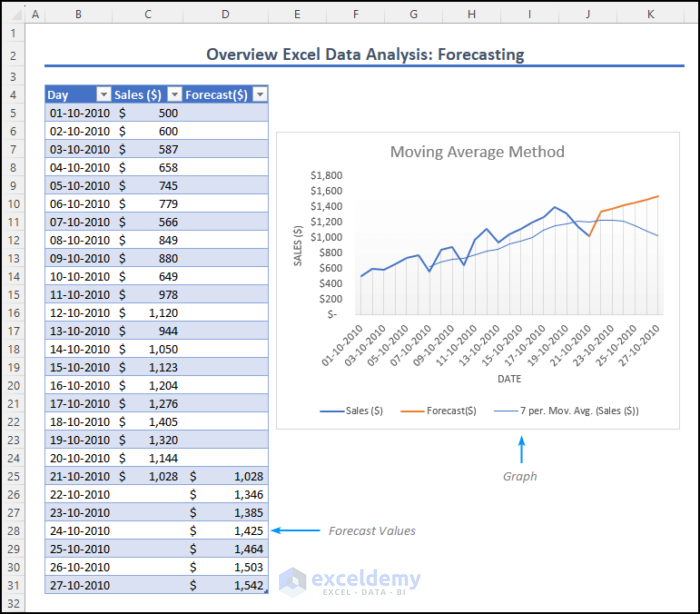
This article will help you understand how to use Excel and its widely used features to perform data analysis and forecasting values. I hope all these ...

How to Do Excel Data Analysis Correlation (4 Easy Ways)

In this article, we will show you how you can use Excel data analysis correlation. Also how you can run data analysis on various data sets using the ...

How to Plot Least Squares Regression Line in Excel (5 Easy Ways)

The least squares regression line is a commonly used statistical method for analyzing the relationship between two continuous variables. It is a ...

How to Create a 4-Variable Data Table in Excel (with Easy Steps)

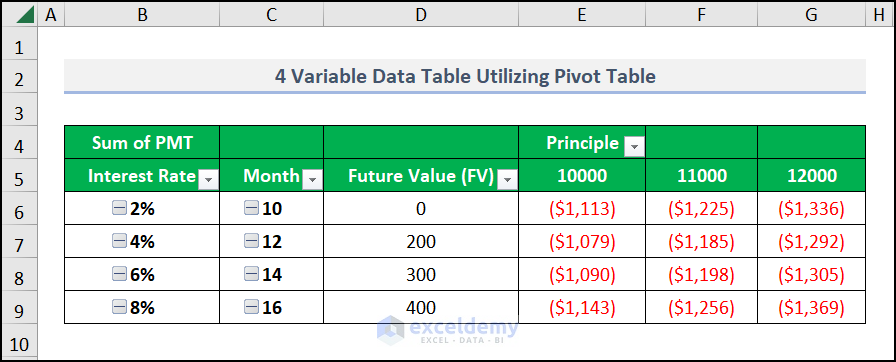
A data table in Excel enables you to experiment with various formula input values and observe how these changes impact the formula's output. Whenever ...

How to Create Price Tags in Excel (with Quick Steps)

In this article, we will demonstrate how to create price tags in Excel with a sample data column. Remember one thing, you can change the data ...

How to Create Data Table with 3 Variables (2 Quick Tricks)

In this article, we will show how to create a data table with 3 variables. Users often have to deal with a data table with 2 variables. However, ...

How to Add Tag to Properties in Excel (with Easy Steps)

If you are looking for how to add tag to Properties in Excel, then you are in the right place. While using Excel we often need to add tag to specify ...

Advanced Excel Exercises with Solutions PDF


ExcelDemy
Logo