In this tutorial, I am going to show you step-by-step procedures on how to make price optimization models in Excel. You can use these steps for any type of dataset and product to quickly find out the most profitable price for your business. Throughout this tutorial, you will also learn some important Excel tools and techniques which will be very useful in any excel related task.
How to Make Price Optimization Models in Excel: Step-by-Step Procedures
We have taken a concise dataset to explain the steps clearly. The dataset has approximately 6 rows and 2 columns. Initially, we are keeping all the cells in General format and the monetary values in Accounting format. For all the datasets, we have 2 unique columns which are Product Price, and Quantity Sold. Although we may vary the number of columns later on if that is needed.

Step-1 Creating Base Dataset in Excel
In this first step, we will be creating the necessary dataset in Excel considering a single product price. Follow the steps below to do this.
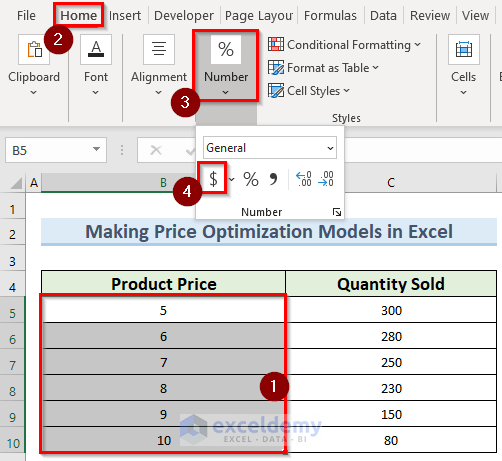
- First, create a dataset with two columns with the names Product Price and Quantity Sold.
- Next, select the cells under the Product Price column and go to the Home tab at the top of the screen.
- Under the Number, section click on Accounting Number Format.
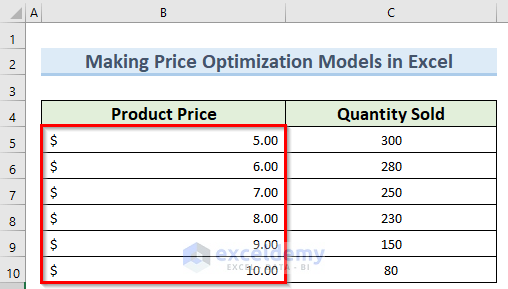
- As a result, this will convert the price values into Dollar format as in the image below.
Step-2 Generating Trendline Equation
After we have created a dataset for our optimization model now is the time to generate a trendline chart which will be the core of our mathematical model. Let us see how we can do this.
- To begin with, select the whole dataset and go to the Insert tab at the top of the screen.
- Then, click on the Scatter chart icon.
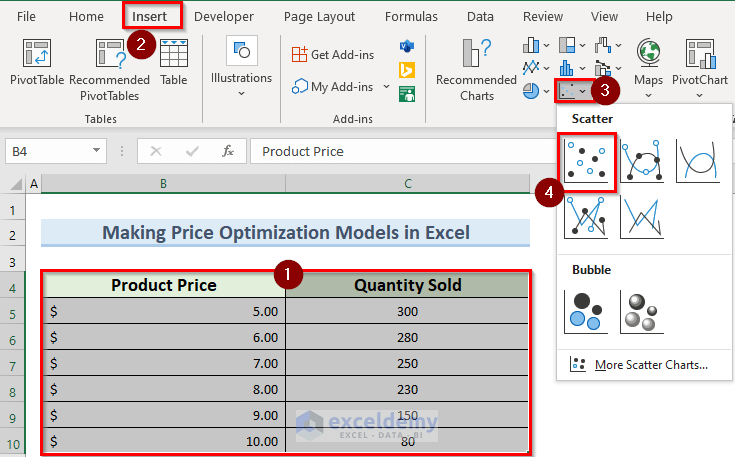
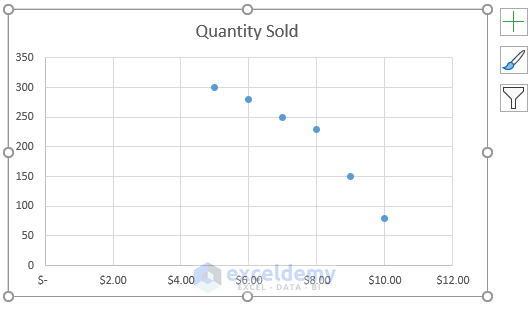
- Consequently, this will plot the data points in a scatter chart.
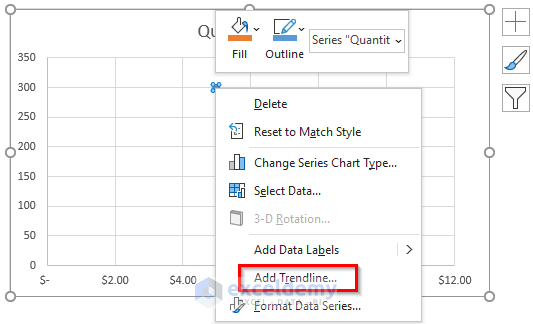
- Next, click on any of the data points and select Add Trendline.
- Now, click on Linear under the Format Trendline pane on the right side.
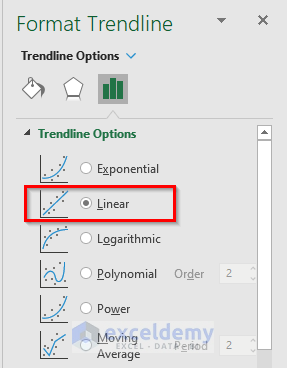
- Then, check the Display Equation on chart box to show the trendline equation.

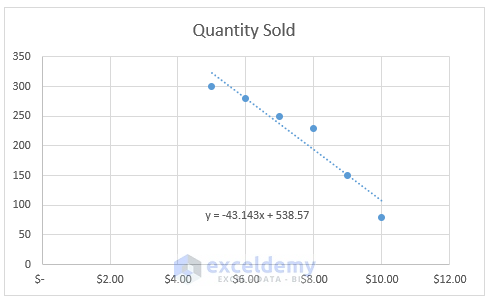
- Immediately, this will draw a trendline through the data points with the equation.
Step-3 Making Price Optimization Models Table in Excel
In this third step, we will insert a price optimization table where we will get the final results. See the steps below to achieve this.
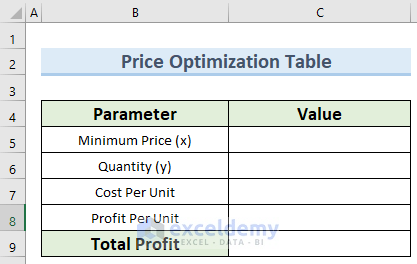
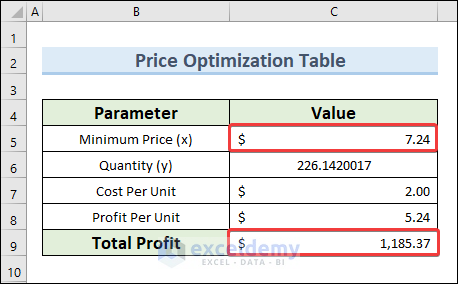
- For this step, create a data table with the Parameter and Value
- Then, insert the necessary parameters such as Minimum Price (x), Quantity (y), Cost Per Unit, Profit Per Unit, and Total Profit.
- Now, insert the minimum price value and type in the following formula in cell C6:
=-(43.143*C5) + 538.57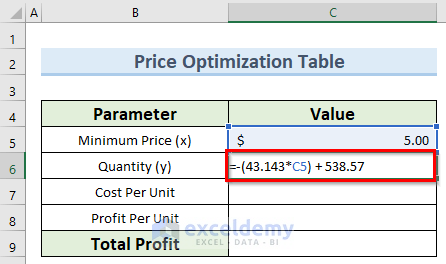
- After that, press Enter and this will give the value of the quantity or y variable in this case.
- Then, enter the cost per unit value and type in the below formula in cell C8:
=C5-C7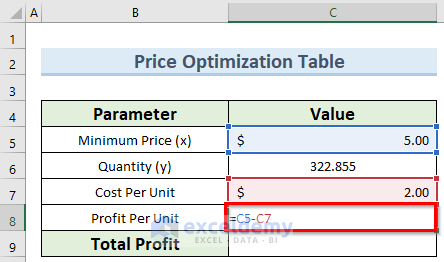
- Again, press the Enter key and you should get the profit per unit value.

- Then, insert the following formula in cell C9 to calculate total profit.
=C6*C8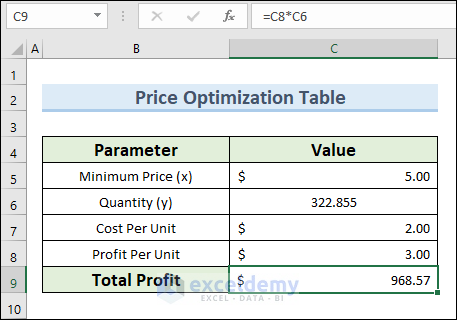
Step-4 Creating Optimization Model
Now, we need to set up the solver in Excel to properly find out the optimal price for our product. Follow the steps below for this.
- To start with this final step, go to the Data tab and click on Solver. If you want to know how to add the Solver option to Excel, you can check out how to use Solver in Excel.
- Now, in the Solver Parameters, insert $C$9 as the Set Objective field value.
- Next, set the To value to Max.
- Then, in the By Changing Variable Cells field, enter $C$5.
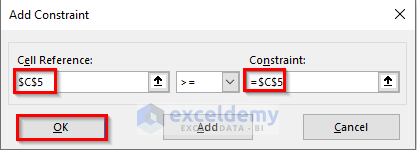
- Now, click on Add to add some constraints.

- Here, type $C$5 in the Cell Reference field and =$C$5 in the Constraint field as values.
- After that, click on OK.
- Now, click on Ok again on the Solver Parameters window as in the image below.
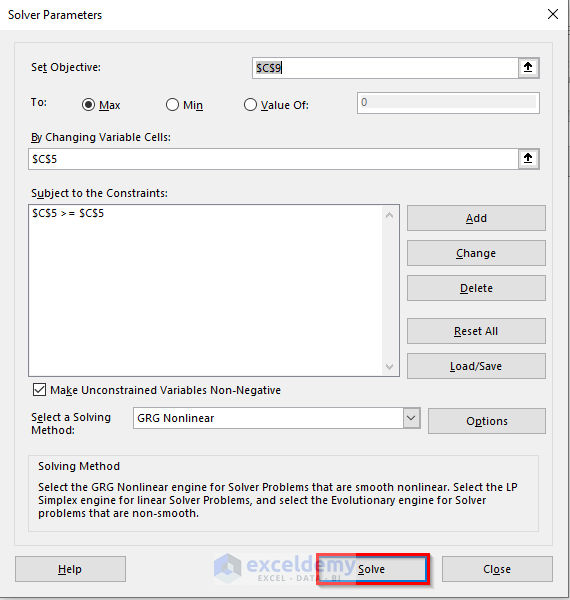
- As a result, this solver model will optimize the minimum price value according to the set constraint to maximize the total profit.
Read More: How to Solve Linear Optimization Model in Excel
Download Practice Workbook
You can download the practice workbook from here.
Conclusion
I hope that you were able to apply the methods that I showed in this tutorial on how to make price optimization models in Excel. As you can see, it involves quite a few steps to achieve this. So carefully follow these while applying them to your own dataset. If you get stuck in any of the steps, I recommend going through them a few times to clear up any confusion. If you have any queries, please let me know in the comments.
Related Articles
- How to Optimize Multiple Variables in Excel
- Excel Optimization with Constraints
- How to Solve Network Optimization Model in Excel
- How to Perform Route Optimization in Excel
- Schedule Optimization in Excel
- Perform Multi-Objective Optimization with Excel Solver
- How to Calculate Optimal Product Mix in Excel
- Mean Variance Optimization in Excel
<< Go Back to Optimization in Excel | Solver in Excel | Learn Excel


Thanks for this but not clear. Your total profit of $1,680.79 is based on your Minimum Price x Quantity.
Shouldn’t it be the Profit per Unit at $4.24 x Quantity which would be $1,142.22?
Hi Mr. Pizzi, thanks for reaching out. I understand your confusion and you are correct. Our goal is to find out the maximum profit by varying the price. We will get the optimum amount of production that will provide maximum profit. As there is a fixed cost, the profit is dependent on the price. To find out the total profit, we have to multiply the quantity by the profit. Thanks again for your feedback.