In this article, I have described what DAX is in Power Pivot and how to use it, including its applications and benefits. I have shown the use of three essential DAX functions: SUMX, CALCULATE, and FILTER functions.
DAX (Data Analysis Expressions) is a powerful formula language used in Power Pivot. It is a feature of Microsoft Excel and Power BI. DAX enables users to do complex calculations and manipulate data relationships within a data model. It enhances the capabilities of data modeling and business intelligence.
Read this article thoroughly to learn more about DAX in Power Pivot.
Download Practice Workbook
It is recommended that you download this workbook for practice.
What Is DAX (Data Analysis Expression)?
DAX (Data Analysis Expressions) is a formula language for Microsoft Power Pivot and Power BI. It is not a coding language. DAX is used for advanced data analysis and modeling. With DAX, users can create custom calculations, like calculated columns and measures. Many DAX functions are similar to Excel functions.
DAX helps to perform complex computations and aggregations on data stored in tables. It offers functions for time-based analysis, filtering, and dynamic slicing. DAX enhances the calculations of interactive reports and dashboards. DAX works on established table relationships. Moreover, DAX empowers users to derive deeper insights. It helps users to make decisions quickly from their data within the Power Pivot.
Applications of DAX in Power Pivot
- DAX helps you to create custom calculations that are not possible with standard Excel formulas. You can create complex calculations that involve multiple tables, relationships, and filters.
- DAX includes a large set of time intelligence functions that can perform calculations based on dates and time periods. You can easily calculate year-to-date, month-to-date, same period last year, and other time-related metrics.
- It enables you to perform calculations at various aggregation levels, such as summing values, calculating averages, finding minimum and maximum values, and more. These calculations can be dynamic and context-aware based on filtering.
- DAX formulas adapt to changes in filters and slicers. It provides dynamic analysis and real-time insights. This feature allows users to explore data from different angles without manually updating formulas.
- It creates advanced metrics and key performance indicators (KPIs) that involve complex calculations and logic.
- This is particularly useful for building meaningful reports and dashboards.
- DAX lets you combine data from multiple tables using functions like RELATED, RELATEDTABLE, and CROSSJOIN.
- You can optimize your data model by creating calculated columns and measures that reduce redundancy and improve performance. This is especially important when dealing with large datasets.
- DAX calculations enhance the user experience by providing interactive reports. Users can interact with visualizations, apply filters, and drill down to get insights.
- DAX is used not only in Power Pivot but also in other Microsoft tools like Power BI and Analysis Services Tabular models.
DAX Functions
DAX functions are designed to work with tables and columns within data models. These are particularly powerful for creating dynamic calculations based on relationships. Here are some DAX functions with categories:
- Aggregation and Calculation: These functions are used to perform calculations on a set of values and return a single aggregated result. Notable functions in this category are: SUM, AVERAGE, MAX, SUMX
- Filtering and Context: Helps to filter and manipulate data based on certain conditions. These are: FILTER, ALL, ALLEXCEPT, VALUES, CALCULATETABLE
- Time Intelligence: Specifically designed for time-based calculations and analysis. Some of these functions are TOTALYTD, DATESYTD, DATEADD, NEXTMONTH
- Logical and Conditional: Logical functions evaluate conditions and return TRUE or FALSE values. The most commonly used functions of this category are: IF, SWITCH, AND, OR, NOT, ISBLANK
- Text and String Manipulation: These functions help you manipulate and work with text values. For example: CONCATENATE, LEFT, RIGHT, MID
- Statistical and Probability: These functions help you to perform statistical calculations on data. This category includes:DIST, NORM.INV, RANKX, PERCENTILEX.INC etc.
- Table Functions: These functions perform operations on tables. For instance, SUMMARIZE, ADDCOLUMNS, VALUES, and so on.
- Time Functions: Specifically designed for time-based calculations and analysis. Time functions include: NOW, TODAY, TIME, YEAR
Syntax of DAX Formulas
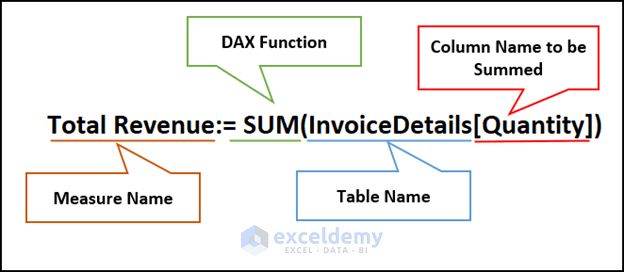
Following is a picture that will help you visualize the syntax of DAX Formulas.

The elements of DAX formulas are discussed here:
- Measure Name: This is the name you want to give to your measure. It should be a unique name that describes the calculation the measure is performing. It is optional.
- Equal Sign (=): The equal sign is used to assign a value to the measure. In DAX, it signifies that you’re defining a new measure and specifying its calculation.
- Functions: DAX formulas are built using various functions. Functions are categorized into different types, such as mathematical, statistical, text, date and time, aggregation, and more. Functions are usually written in uppercase, but DAX is case-insensitive, so you can use lowercase as well.
- Arguments: Functions take arguments enclosed in parentheses. Arguments can be constants, column or table references, or other functions. Arguments are separated by commas.
- DAX Operators: DAX supports various operators, such as arithmetic (+, -, *, /), comparison (=, <>, <, >, <=, >=), logical (AND, OR, NOT), and more. Operators are used to create conditions and perform calculations.
- Column References: You can reference columns from tables in your data model using square brackets. For example, [Quantity] refers to the “Quantity” column.
- Table References: You can reference tables using single quotes. For example, ‘InvoiceDetails’ refers to the “InvoiceDetails” table.
DAX Operators
DAX includes a variety of operators that perform different types of operations on data. Here are some of the main types of DAX operators:
| Category | Operator | Meaning | Example |
|---|---|---|---|
| Arithmetic | + (Addition) | Adds two numbers | Sales[Amount] + 100 |
| – (Subtraction) | Subtracts one number from another | Expenses[Cost] – 50 | |
| * (Multiplication) | Multiplies two numbers | Orders[Quantity] * Products[UnitPrice] | |
| / (Division) | Divides one number by another | Revenue[Total] / Sales[UnitsSold] | |
| % (Modulus) | Returns the remainder of division | Customer[TotalPurchases] % 5 | |
| Logical | && (AND) | Logical AND operation | IF(Customer[Age] >= 18 && Customer[IsPremium], 1, 0) |
| || (double pipe symbol) OR | Performs a logical OR operation on multiple conditions. | IF(Customer[Age] >= 18 ||
Customer[IsPremium], 1, 0) |
|
| Comparison | = (Equal) | Compares two values for equality | IF(Customer[State] = “CA”, “West”, “Other”) |
| <> (Not Equal) | Compares two values for inequality | IF(Product[Category] <> “Electronics”, 1, 0) | |
| > (Greater Than) | Checks if one value is greater than another | IF(Sales[Quantity] > 10, “High”, “Low”) | |
| < (Less Than) | Checks if one value is less than another | IF(Orders[TotalAmount] < 500, “Small”, “Large”) | |
| >= (Greater Than or Equal To) | Checks if one value is greater than or equal to another | IF(Customer[Age] >= 21, “Adult”, “Minor”) | |
| <= (Less Than or Equal To) | Checks if one value is less than or equal to another | IF(Employee[YearsOfService] <= 5, “Junior”, “Senior”) | |
| Text | & (ampersand) | Connects, or concatenates, two values to produce one continuous text value | [Region] & “, ” & [City] |
Prepare Data to Apply DAX in Power Pivot
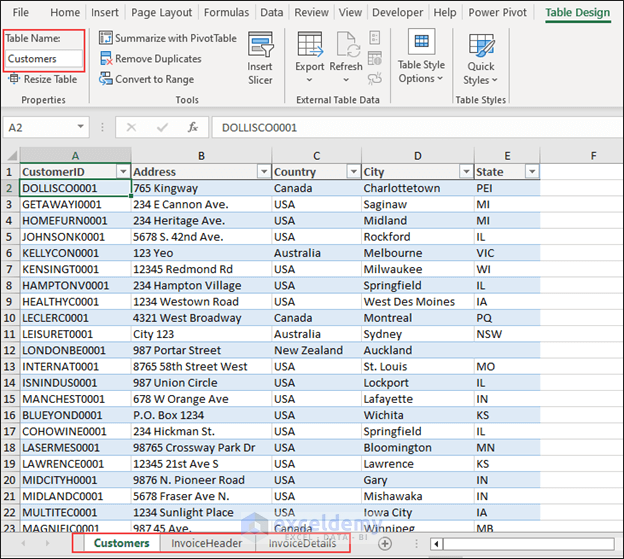
I will use an Excel workbook that contains three worksheets. These sheets contain data about “Customers”, “Invoice Header” and “Invoice Details”. To apply DAX in Power Pivot, you have to prepare your dataset first. Follow these steps:
- To begin, convert each sheet’s dataset into a table.
- It is mandatory to give each table a relevant name so that you can recognize it while writing DAX Click on Table Design >> edit the Table Name.
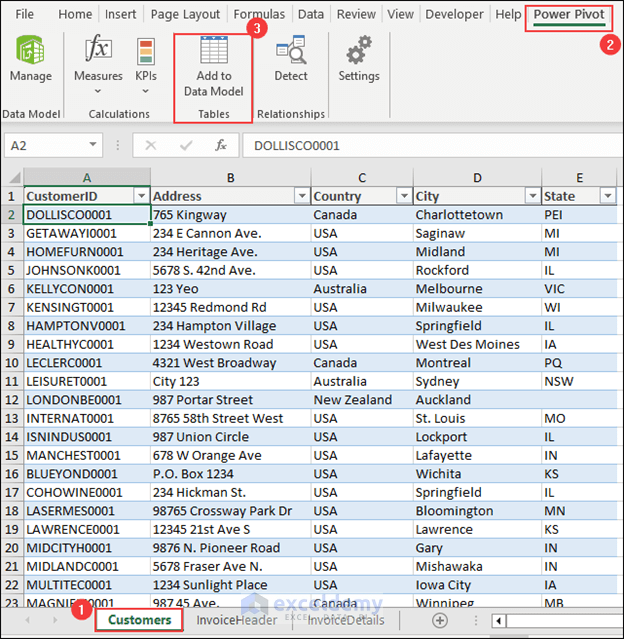
- Then, open the sheet you want to add to the Data Model of the Power Pivot.
- Now, click on the Power Pivot tab >> select Add to Data Model.
- Add the other tables to the data model following the same steps.
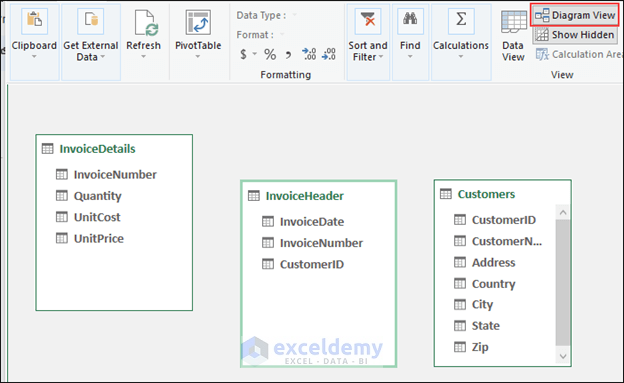
- Click on the Power Pivot tab >> select Manage.
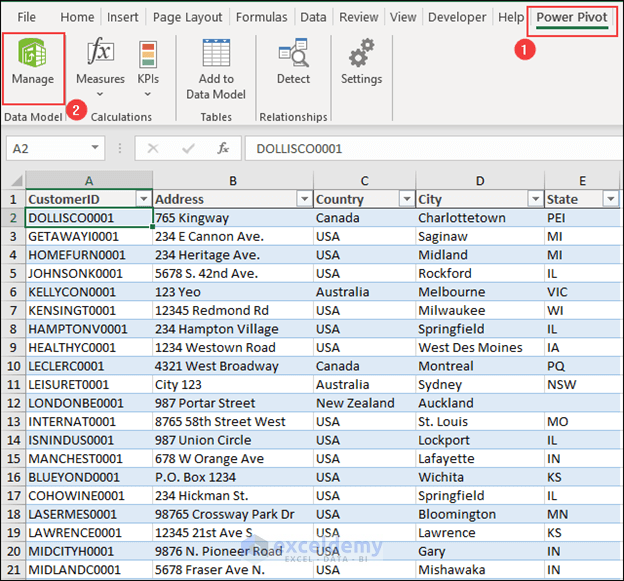
- As a result, the Power Pivot mode of Excel will show up.
- Since I will create a relationship between the tables now, I have selected the Diagram View.
- Select the field name of the table with which you will create a relationship with another table.
- Now, drag the field and bring this to the similar field of the second table.
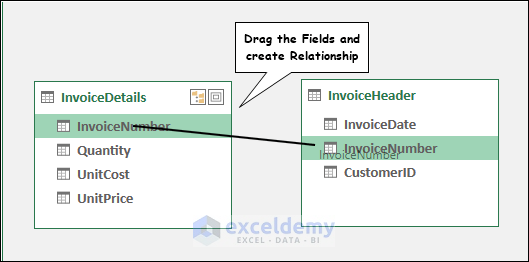
- Therefore, I have created the relationship between the tables “InvoiveDetails” and “InvoiceHeader” based on the common field InvoiceNumber.

- Create all the relationships by dragging and joining.

- If you are able to create relationships, click on the Data View.
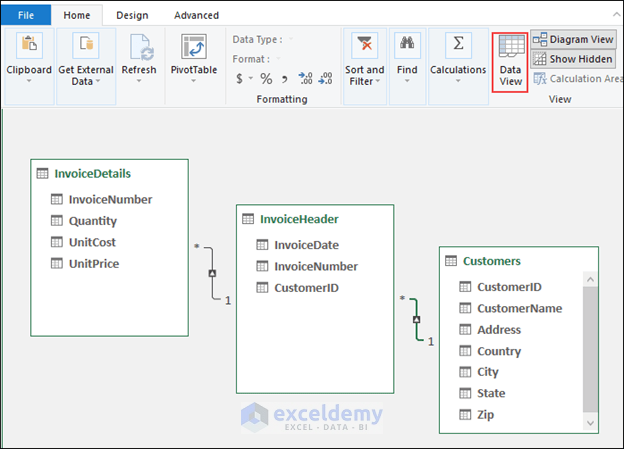
- Thus, the Data View of the sheets will appear.
- Now, you can apply DAX formulas or functions to determine the calculated field.

Where to Use DAX Formulas
DAX Formulas can be used in two different places in Power Pivot. Here’s how you can access and write DAX formulas in Excel using Power Pivot.
1. Calculated Column
In Power Pivot, a calculated column is a column that you can create within a table using Data Analysis Expressions (DAX) formulas. Using DAX formulas, you can do calculations based on the values in other columns of the same table or other related tables. Calculated columns are then populated with the calculated values for each row in the table.
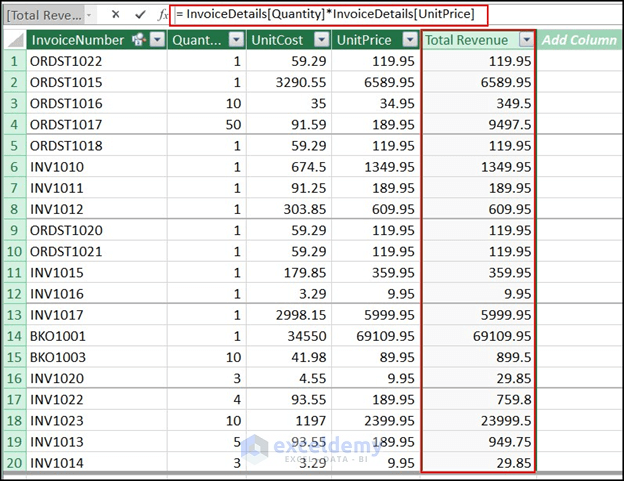
- Click on the header of the Add Column named column.
- Write this formula in the formula bar.
=InvoiceDetails[Quantity]*InvoiceDetails[UnitPrice]- Finally, press the Enter button.
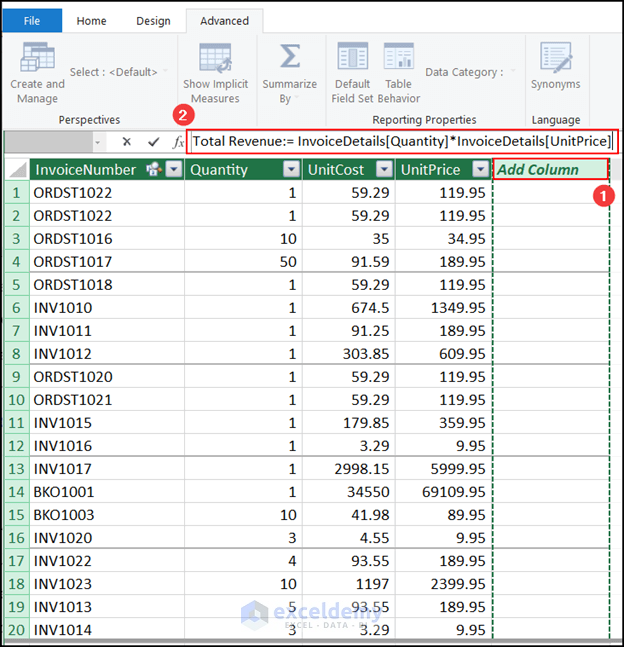
- Consequently, I have calculated Total Revenue using a formula. The column header is changed, as I wrote in the formula. You can also click on the column header and edit the name.
2. Measures Command in Power Pivot
In Power Pivot within Excel, a measure is a DAX formula that calculates an aggregation, calculation, or result based on a set of values.
There are certain differences between Calculated Columns and Measures. Calculated Columns are computed during data loading or refreshing. The calculations are performed once, and the results are stored as a new column in the table. On the other hand, Measures are specifically designed for performing aggregations and calculations that involve summarizing data, such as sums, averages, counts, ratios, etc.
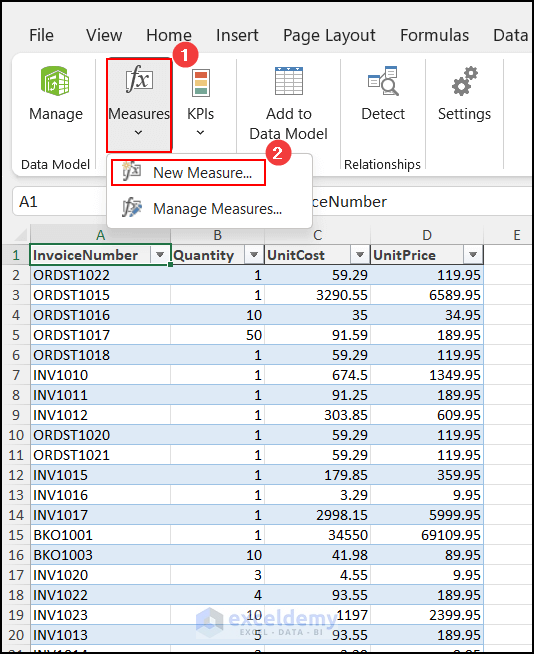
- Staying on the Power Pivot tab, click on Measures >> then select New Measure….
- As a result, the Measure dialog box will appear.
- First, select the Table name by clicking on the dropdown.
- Then, give a relevant name in the Measure name (e.g. Gross Revenue) textbox.
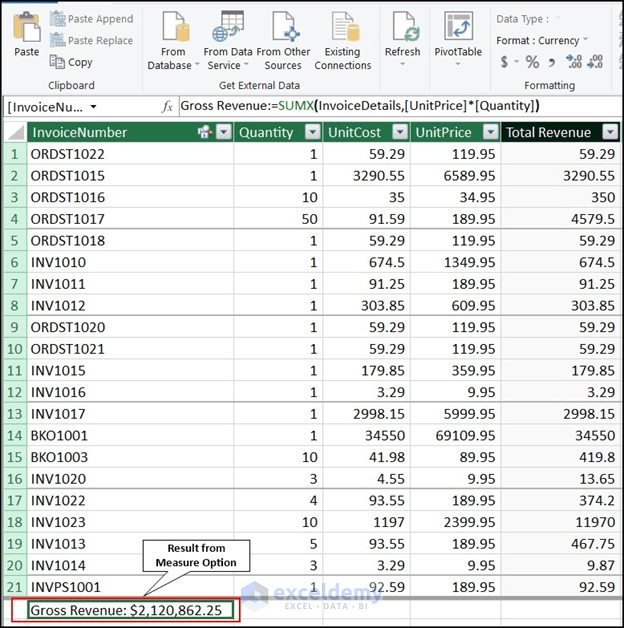
- Now, write the following formula in the Formula box.
=SUMX(InvoiceDetails,[Quantity]*[UnitPrice])- Select the number format from the Category I have selected Currency.
- Select the Currency symbol and set Decimal places.
- Finally, click OK.

- Therefore, you got the Gross Revenue at the bottom of the “InvoiceDetails” table.
How to Use DAX Functions in Power Pivot: 3 Examples
1. SUMX Function
The SUMX function in DAX is used to iterate over a table. It applies an expression to each row and then sums up the results of the expression. It’s particularly useful when you want to perform a calculation on each row of a table and then aggregate those individual results into a final sum.
Syntax:
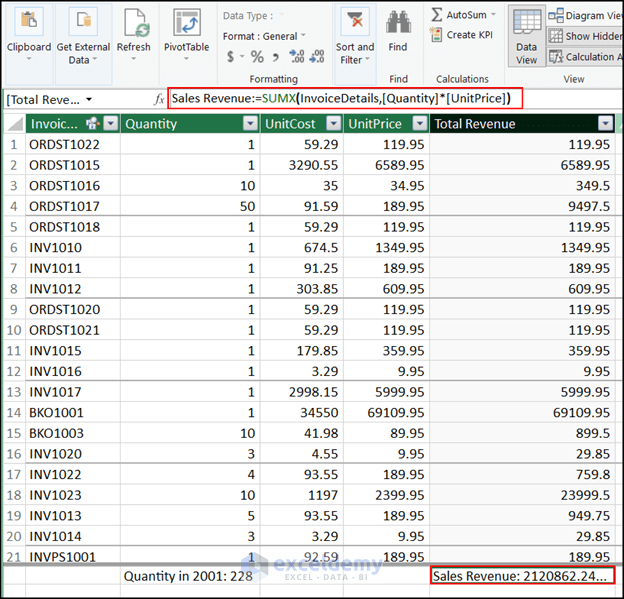
SUMX(table, expression)I want to calculate the “Sales Revenue” by multiplying the quantity and unit price for each order and then summing these values. In this case, no other function is appropriate other than the SUMX function in DAX.
- Select the cell where you want to show the calculated value.
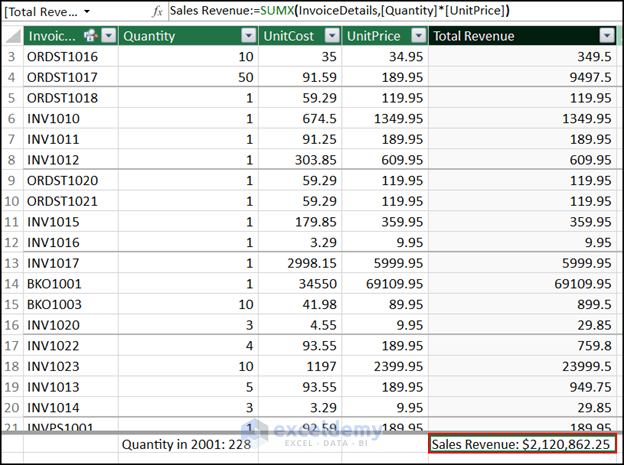
- Write this formula:
Sales Revenue:=SUMX(InvoiceDetails,[Quantity]*[UnitPrice])- Hit the Enter button, and you got “Sales Revenue” by using the SUMX function.
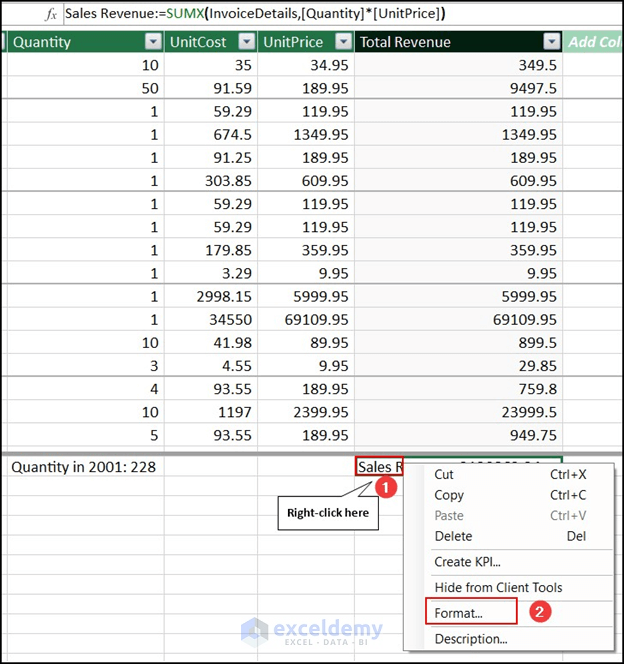
- If you want to change the number format of the Sales Revenue, right-click on the cell.
- Select Format… from the context menu.
- The Formatting dialog box will pop up.
- In Category, select Currency.
- Define the Symbol and Decimal places.
- Press OK.

- Therefore, you can see that the formatting has changed.
2. CALCULATE Function
The CALCULATE function is a powerful and versatile function in DAX. It helps to modify the context in which a DAX expression is evaluated. This is particularly useful for applying filters, changing row context, and performing calculations based on specific conditions.
Syntax:
CALCULATE(<expression>, <filter1>, <filter2>, ...)In this dataset, I want to calculate the sum of Quantity of the orders. But only for the year “2001”. Here, I will combine the CALCULATE function with the SUM function.
- Click on the cell where you want to insert the formula.
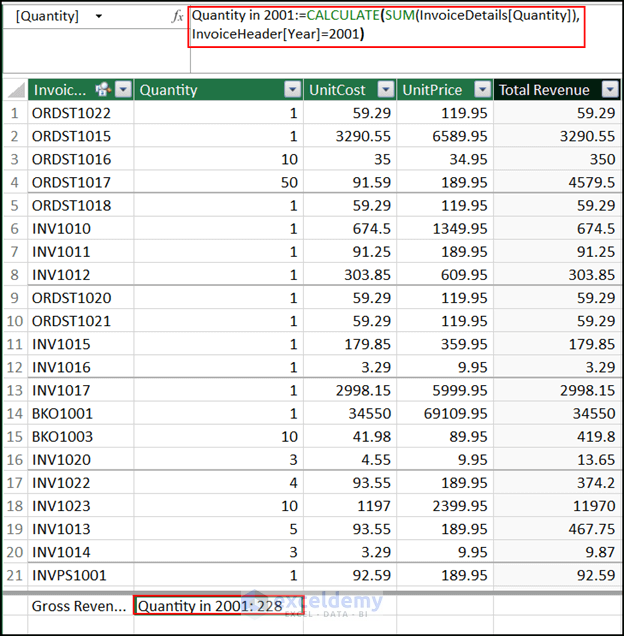
- Write this formula:
Quantity in 2001:=CALCULATE(SUM(InvoiceDetails[Quantity]), InvoiceHeader[Year]=2001)- Press Enter, and you’ll get the result.
- SUM(InvoiceDetails[Quantity]): This part calculates the sum of the “Quantity” column from the “InvoiceDetails” table. It’s adding up all the quantities listed in the “Quantity” column.
- InvoiceHeader[Year]=2001: This part is a filter condition. It specifies that you are interested in data where the “Year” column in the “InvoiceHeader” table has a value of 2001.
- CALCULATE(…): This is a DAX function used in Excel Power Pivot. It modifies the context of a calculation by applying additional filters. In this case, it’s using the previous two parts to calculate the sum of quantities, but only for the data where the year is 2001.
3. FILTER Function
The FILTER function in DAX is used to filter data from a table based on a specified condition or set of conditions. It returns a table that contains only the rows that meet the specified criteria.
Syntax:
FILTER(Table, Condition)In my dataset, I want to calculate the sales only for the quantities which are greater than “10”. In this case, I will merge the FILTER function with the SUMX function.
- To begin, click on the cell where you want to get the result.
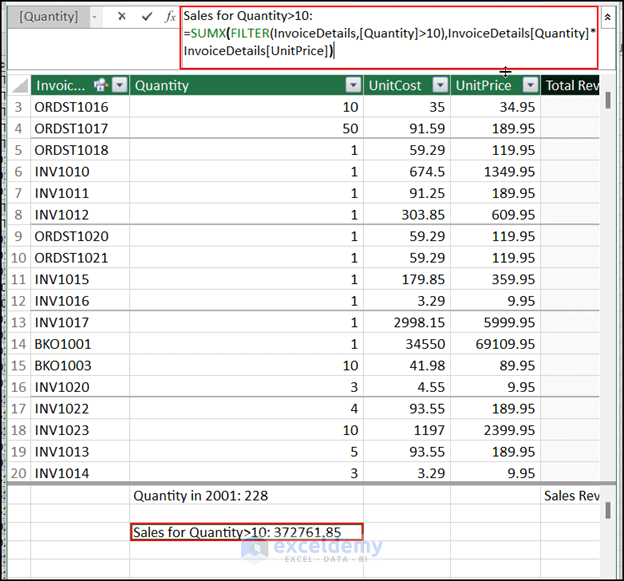
- Now, copy this formula:
Sales for Quantity>10:=SUMX(FILTER(InvoiceDetails,[Quantity]>10),InvoiceDetails[Quantity]*InvoiceDetails[UnitPrice])- Press the Enter button, and you will get the result.
- FILTER(InvoiceDetails, [Quantity] > 10): This part of the formula uses the FILTER function to create a temporary table by filtering the “InvoiceDetails” table. It includes only the rows where the “Quantity” column has a value greater than 10.
- InvoiceDetails[Quantity] * InvoiceDetails[UnitPrice]: This part calculates the product of the “Quantity” and “UnitPrice” columns from the “InvoiceDetails” table. This effectively calculates the total cost for each row (item) in the filtered temporary table created in previous step.
- SUMX(FILTER(…), …): It uses the SUMX function to iterate through the filtered temporary table created in step 1 and sum up the values calculated in step 2. It effectively calculates the total sales value for all items in the “InvoiceDetails” table where the quantity is greater than 10.
- Sales for Quantity > 10: This is the name given to the calculated measure (result) of the formula. It represents the total sales value for items with a quantity greater than 10.
Nested DAX Formulas in Power Pivot
Nested DAX functions mean combining multiple DAX functions within a single formula to create more complex and specialized calculations in Power Pivot or Power BI. Nested functions utilize the output of one function as an input to another.
Here is an example where I have combined the DIVIDE and SUM functions to determine the percentage of Gross Revenue.
- Write this formula in a new column.
=DIVIDE(InvoiceDetails[Total Revenue], SUM(InvoiceDetails[Total Revenue]))- Press Enter. You should format the column as percentage to get the values.
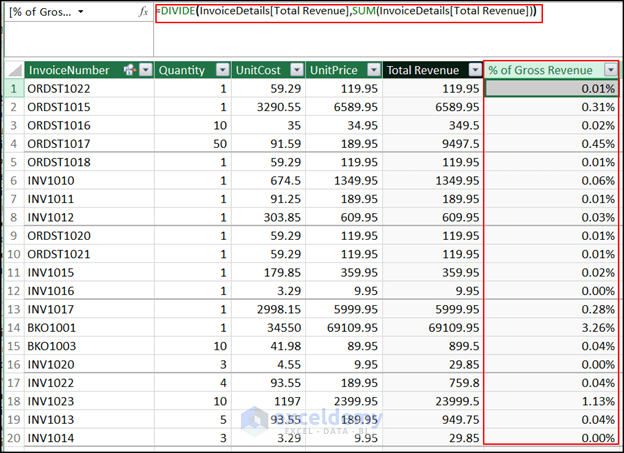
- =DIVIDE(: This indicates the start of the DIVIDE function, which is used to perform division in DAX.
- InvoiceDetails[Total Revenue]: This is the numerator of the division. It refers to the column “Total Revenue” in the “InvoiceDetails” table.
- SUM(InvoiceDetails[Total Revenue]): This is the denominator of the division. It calculates the sum of the “Total Revenue” column in the “InvoiceDetails” table, which represents the total revenue across all invoices.
Troubleshooting in DAX Formulas
Troubleshooting DAX formulas can sometimes be challenging. Fortunately, there are several strategies you can use to resolve the issues. Here are some steps you can follow when troubleshooting DAX formulas:
- Review your DAX formula for syntax errors, such as missing parentheses, incorrect function names, or unmatched quotation marks. A small syntax mistake can lead to unexpected results or errors.
- Add comments to your DAX formulas to explain their purpose and structure. Comments can help you understand your formulas better.
- Make sure that the data types of the columns you’re using in your DAX formula match the expected types. DAX is sensitive to data types, and mismatches can lead to errors or unexpected behavior.
- Use DAX tools to evaluate and visualize intermediate results. In Power BI or Power Pivot, you can use the “Evaluate” or “Formula Engine” options to see how DAX expressions are being calculated step by step.
- f you’re troubleshooting a measure, check its dependencies. In Power BI, you can use the “View dependencies” feature to see which columns and measures are used in a particular measure.
- Break down complex DAX formulas into smaller components and test each part separately. This can help you to find the issue if the entire formula isn’t working as expected.
- If you’re working with multiple tables, ensure that your relationships are set up correctly. Incorrect relationships can lead to unexpected results in your calculations.
- Some third-party tools or plugins offer debugging capabilities for DAX formulas.
Things to Remember
- Define relationships between tables in your Power Pivot data model. DAX calculations will rely on these relationships for accurate results.
- Give a unique name to each measure or calculated column. DAX formulas don’t allow identical column names.
- DAX calculations are sensitive to the context in which they are calculated. Be aware of row context and filter context when creating measures or calculated columns.
- DAX functions can be categorized into iterators (e.g., SUMX, AVERAGEX) and aggregators (e.g., SUM, AVERAGE). Choose the right type of function depending on your calculation needs.
- Test your DAX formulas thoroughly with sample data before applying them. Use tools like DAX Studio or the formula engine in Power Pivot. These help debug and troubleshoot your calculations.
Frequently Asked Questions
1. Where to find the DAX Function List
You can find a comprehensive list of DAX functions and their descriptions in the official Microsoft documentation for Power BI, Power Query, and Analysis Services.
DAX documentation contains a description, syntax, parameters, remarks, and an example.
It should be noted that not all functions offered in Power BI are also available in Excel. Unfortunately, the documentation does not indicate whether or not a function is present in Excel. The only way to find out is to attempt it, and if the intellisense does not auto-complete the function name as you type, it isn’t available.
2. Is DAX a programming language?
No, DAX (Data Analysis Expressions) is considered as a formula language. It is used primarily in Microsoft Power BI, Power Pivot, and Analysis Services. It is used for creating custom calculations, measures, and calculated columns within data models. DAX is designed to work with tabular data models and is focused on performing data analysis and calculations.
Again, DAX is not a general-purpose programming language like Python or Java. But it shares some similarities with programming languages.
3. What is “DAX tools”?
“DAX tools” generally refer to a collection of resources, utilities, and software that are used to work with DAX. These tools are used in Microsoft Power BI, Power Pivot, and Analysis Services. These tools are designed to help users create, manage, and optimize DAX calculations and data models. Here are some key components that fall under the category of DAX tools:
- Power BI Desktop: Power BI Desktop is a powerful tool for creating interactive reports and dashboards. It includes a DAX formula editor where you can create custom measures and calculated columns. It also provides data modeling capabilities to build relationships between tables and create data models.
- DAX Studio: DAX Studio is the only application that provides an advanced environment for writing, testing, and optimizing DAX It offers features like syntax highlighting, query execution, and performance analysis. It’s particularly useful for users who want more control over their DAX code and performance tuning.
- DAX Formatter: The DAX Formatter is a web-based tool that helps you format your DAX code for better readability. It automatically indents, colors, and organizes your code according to standard conventions.
4. What’s the difference between DAX and Excel functions?
DAX (Data Analysis Expressions) is a formula language used in Power BI, Power Pivot, and Analysis Services. It is used for advanced data modeling, complex calculations, and analysis of data relationships.
On the other hand, Excel functions are used within Microsoft Excel for basic calculations and data manipulation. They work within individual cells. Excel functions are suitable for simpler tasks. But these functions are less efficient for large datasets and complex analysis.
5. What is Power Pivot vs Pivot Table?
Power Pivot is a data modeling and analysis feature provided by Microsoft Excel and Microsoft Power BI. It allows you to import, model, and analyze large amounts of data from various sources within an Excel workbook or a Power BI project. It helps you to create more sophisticated data models, relationships between tables, and custom calculations using the DAX formula language. Power Pivot is especially useful when working with large datasets.
On the other hand, PivotTable is a data summarization and visualization tool available in Excel. It allows you to quickly summarize and analyze data from a table or range by grouping and aggregating values.
Conclusion
In this article, I have tried to show the basics of the DAX formulas in Power Pivot. I hope that by reading this article, you have learned how to use DAX formulas and functions in Power Pivot properly. I would suggest practicing other functions of DAX as well to master Power Pivot. Please leave a comment if you have any questions about this topic.
DAX in Power Pivot: Knowledge Hub
<< Go Back to Power Pivot Excel | Learn Excel

