In this article, you will learn about break even analysis in Excel. It covers everything about break-even analysis. Here, you will also learn about the break-even formula and how to create a template for break-even analysis.
Break-even is one of the most essential parameters when you are starting a business. A break-even analysis is a way to figure out how much money you need to make from selling a product or service to cover all your expenses. It helps you find the point where you start making a profit instead of losing money.
Download Practice Workbook
You can download the practice workbook from here.
What Is Break-Even Analysis?
Break-even analysis shows the number of sales or units that need to be sold to achieve zero profit. This means when you will be able to cover all the expenses without having any profit or loss.
Break-Even Analysis Formula
The break-even point satisfies the following formula.
Where,
So, the number of units that need to be sold at the break-even point becomes.
Here,
Different Ways to Analyze Break Even Point
There are different ways to analyze the break-even point. They are:
1. Break-Even Units: The units that need to be sold to reach the break-even point. The formula for Break Even Units is:
Here,
2. Break-Even Sales: This is the sales at the break-even point. The formula for break-even sales is:
Here,
3. Break-Even Price: This is the price of the product you will need for reaching the break-even point when you know the production volume. The formula is:
How to Do Break-Even Analysis in Excel
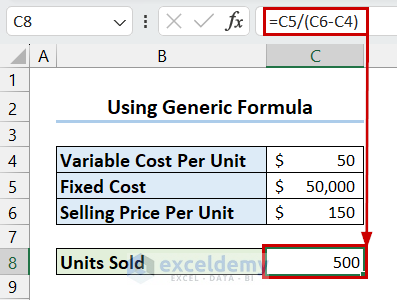
1. Use Generic Formula to Calculate Break-Even Point
- Select the cell where you want the Units Sold at the break-even point >> write the following formula.
=C5/(C6-C4)- Press Enter to get the result.
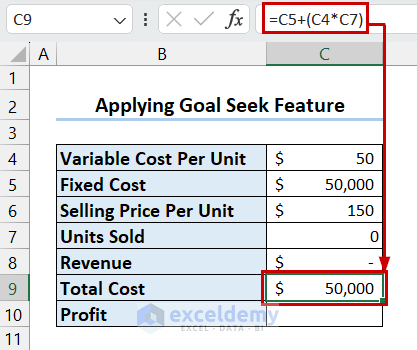
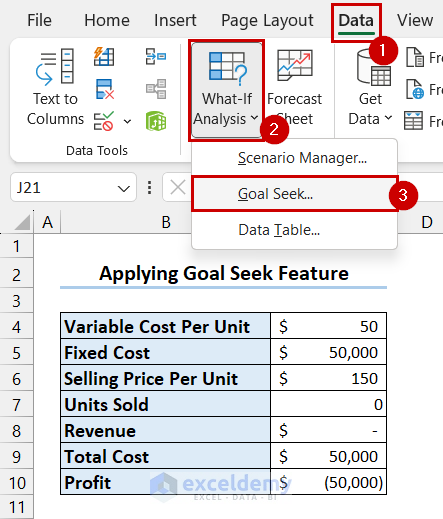
2. Apply Goal Seek Feature to Calculate Break Even Point in Excel
- Select the cell where you want the Revenue >> write the following formula.
=C6*C7- Press Enter.

- Select the cell where you want the Total Cost >> write the following formula.
=C5+(C4*C7)- Press Enter.
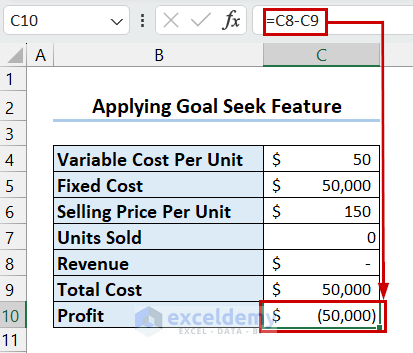
- Select the cell where you want the Profit >> write the following formula.
=C8-C9- Press Enter and you will get the Profit.
- Go to the Data tab >> select What-If Analysis >> select Goal Seek.
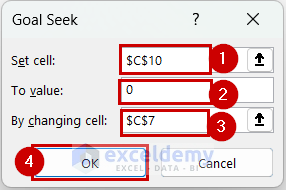
- Select the cell that contains Profit as Set cell >> select To value as 0 >> select the cell that contains Units Sold as By changing cell >> select OK.
- Goal Seek Status dialog box will appear >> select OK.
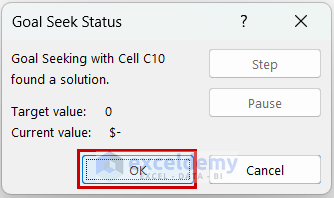
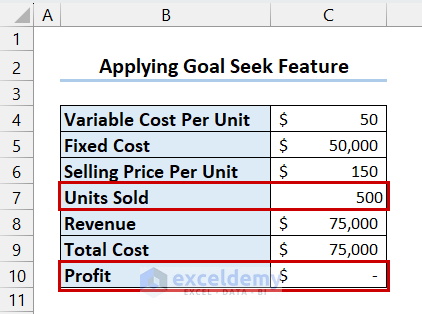
- Finally, you will see that you have got the Units Sold at the break-even point.
3. Use Data Table Feature to Find Break Even Point in Excel
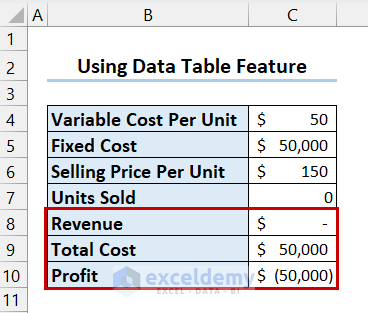
- Find out the Revenue, Total Cost, and Profit by following the steps from the previous method.
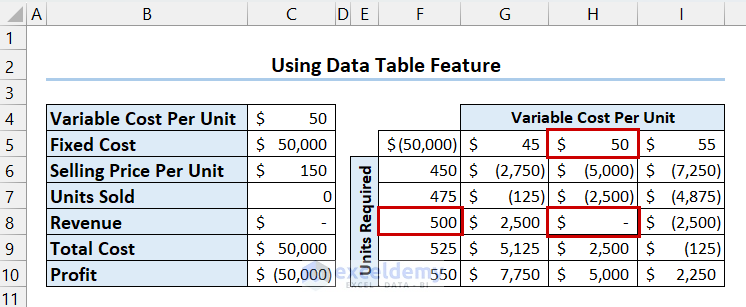
- Create a table like the following image.
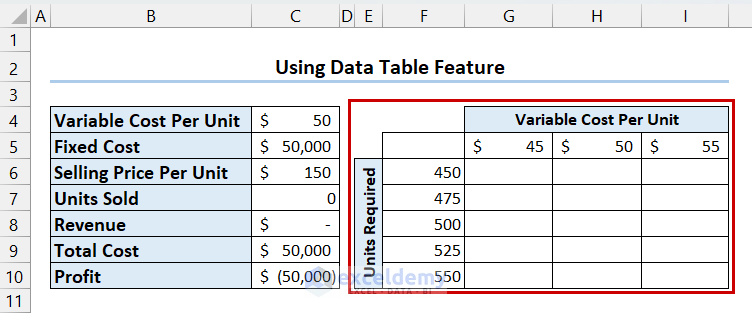
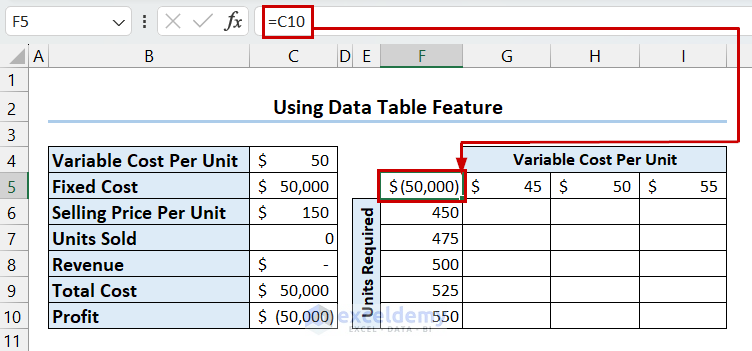
- Select the first cell of the table >> write the following formula to get the profit here.
=C10- Press Enter.
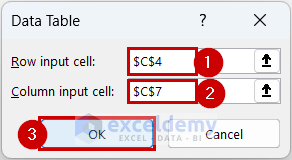
- Select the table >> go to the Data tab >> select What-If Analysis >> select Data Table.
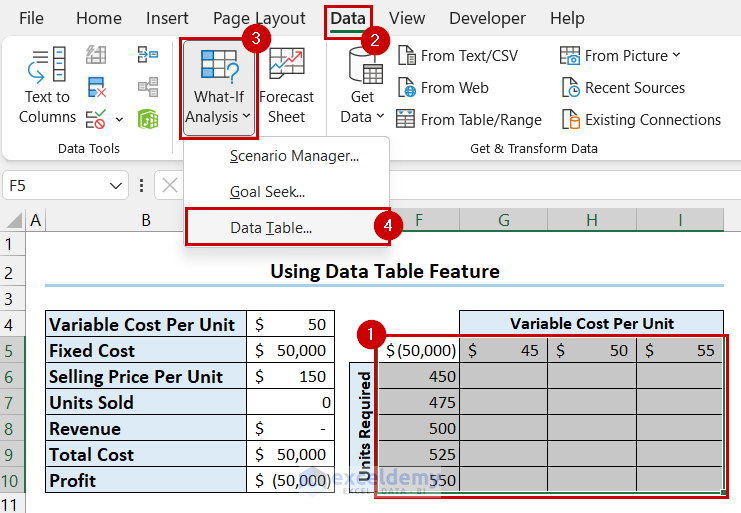
- The Data Table feature will appear >> select Variable Cost Per Unit as the Row input cell >> select Units Sold as the Column input cell >> select OK.
- Finally, you can see that when the Variable Cost Per Unit is $50 you will need to sell 500 products to reach the break-even point.
4. Perform Break Even Analysis in Excel with Charts
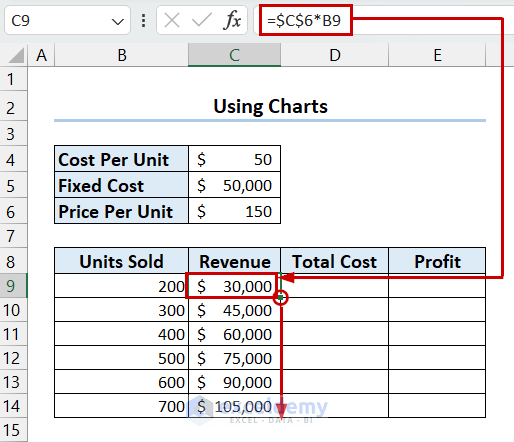
- Select the cell where you want the Revenue >> write the following formula.
=$C$6*B9- Press Enter >> drag the Fill Handle down to copy the formula to the other cells.
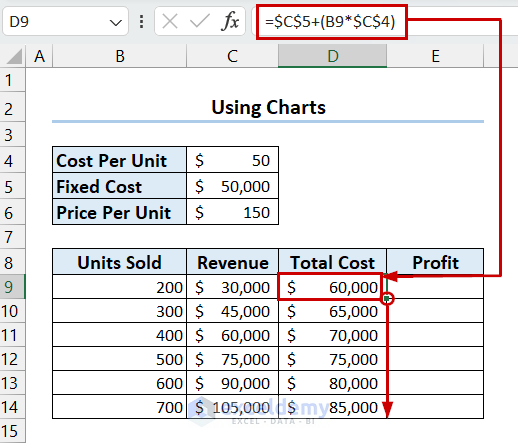
- Select the cell where you want the Total Cost >> write the following formula.
=$C$5+(B9*$C$4)- Press Enter >> drag the Fill Handle down to copy the formula to the other cells.
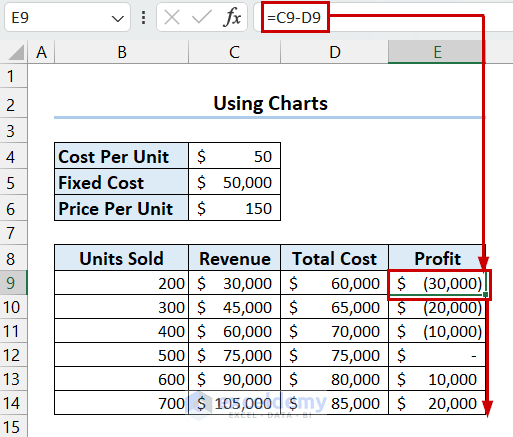
- Select the cell where you want the Profit >> write the following formula.
=C9-D9- Press Enter >> drag the Fill Handle down to copy the formula to the other cells.
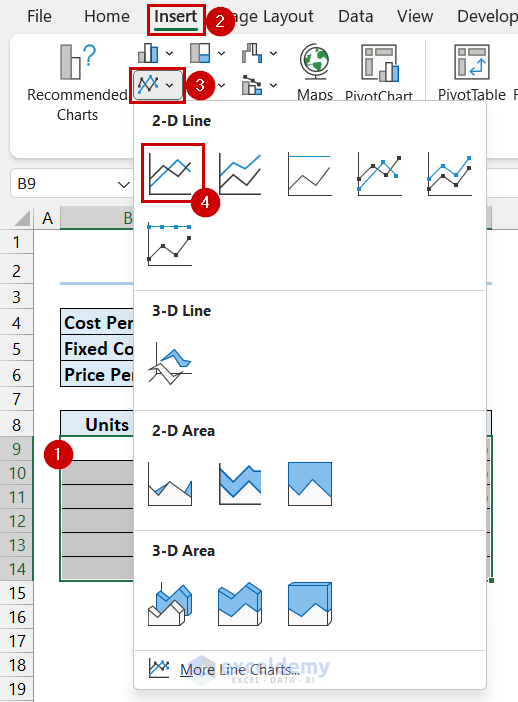
- Select the data table you created for the chart >> go to the Insert tab >> select Insert Line or Area Chart >> select Line.
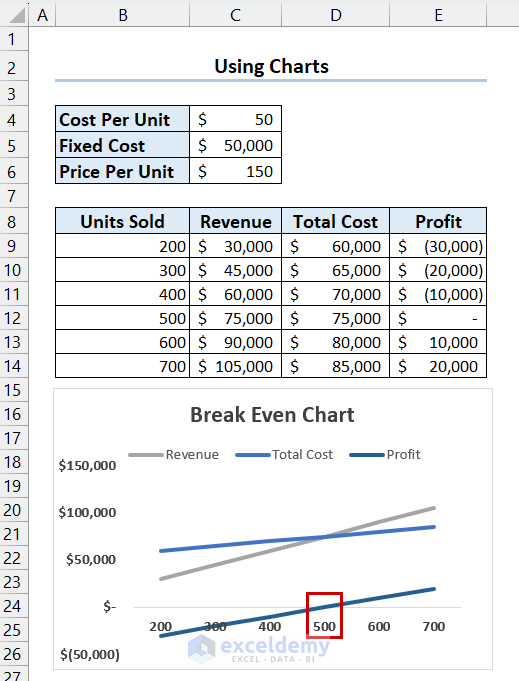
- Finally, you will see the break-even point in the chart.
Break Even Analysis Template in Excel
Step-01: Create Section for Product Details
- Create a section for Product Details >> fill up the section with information about the product.

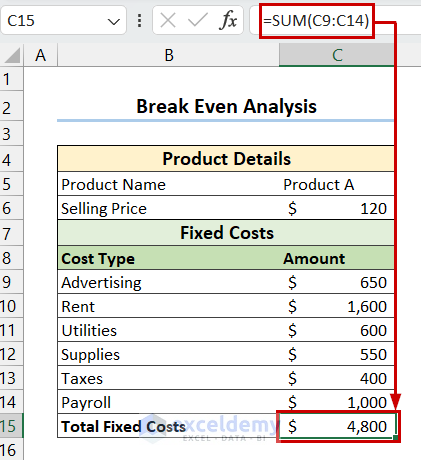
Step-02: Calculate Fixed Cost
- Create a section for Fixed Costs >> fill that section with the necessary information.
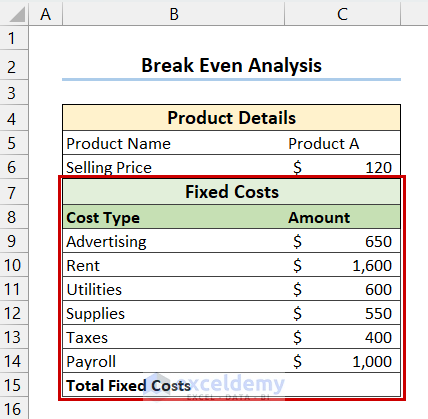
- Select the cell where you want the Total Fixed Costs >> write the following formula.
=SUM(C9:C14)- Press Enter.
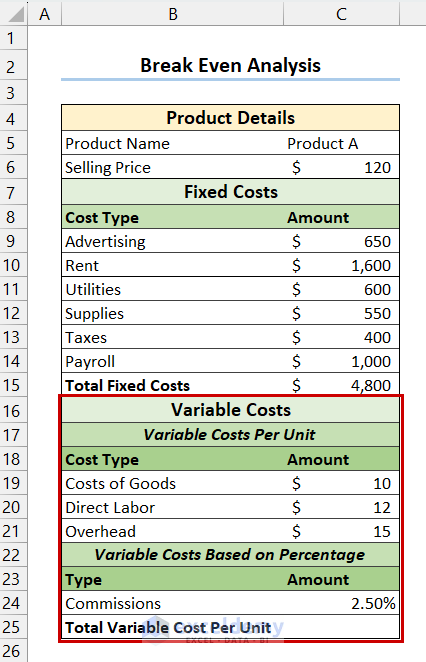
Step-03: Find Total Variable Cost Per Unit
- Create a section for Variable Costs >> fill that section with the necessary information.
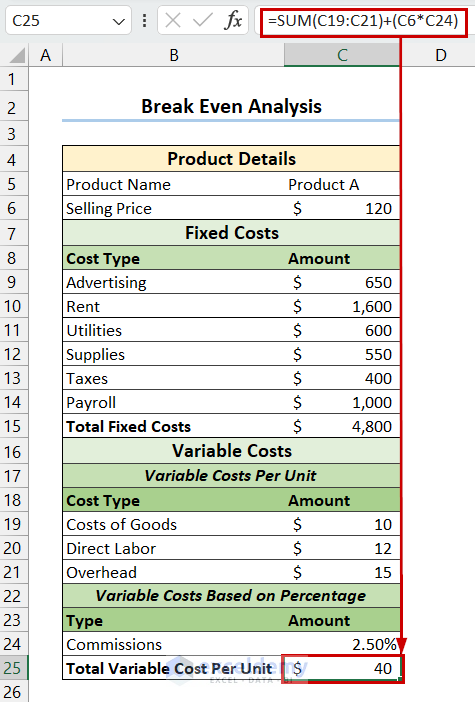
- Select the cell where you want the Total Variable Cost Per Unit >> write the following formula.
=SUM(C19:C21)+(C6*C24)- Press Enter.
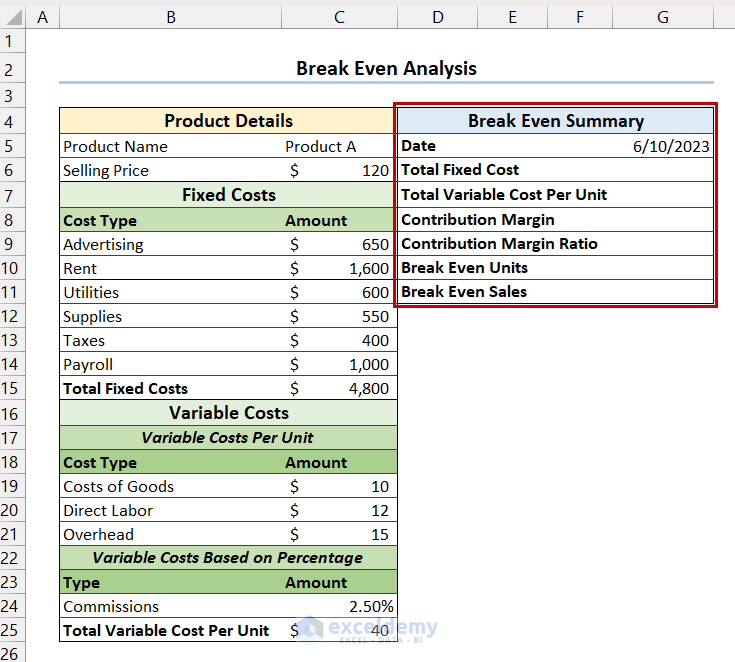
Step-04: Create Break-Even Summary Section
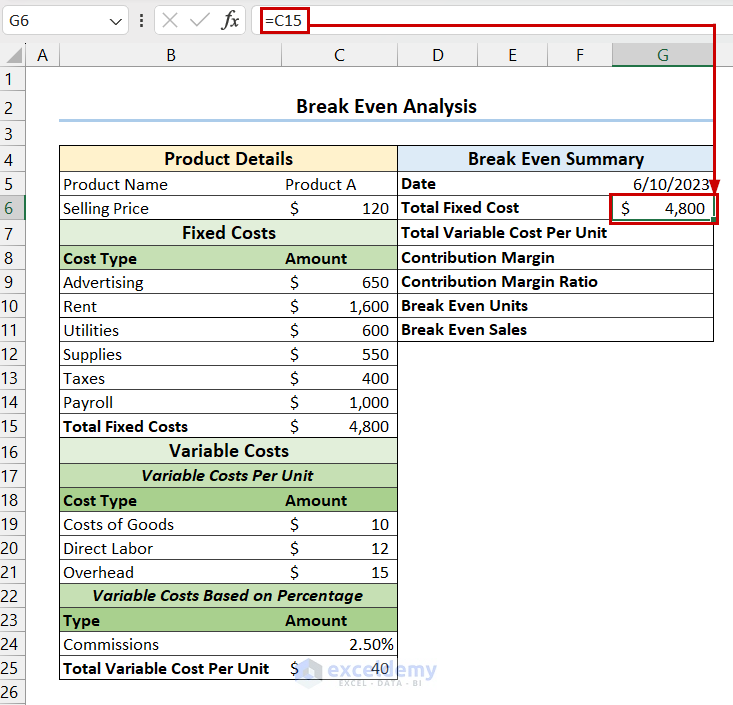
- Create a section for Break-Even Summary.
- Select the cell where you want the Total Fixed Cost >> write the following formula.
=C15- Press Enter.
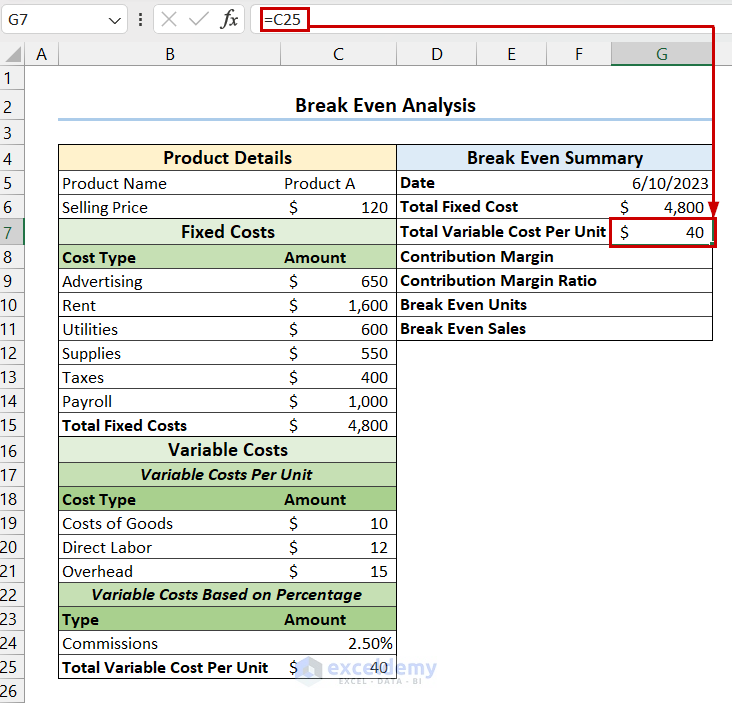
- Select the cell where you want the Total Variable Cost Per Unit >> write the following formula.
=C25- Press Enter.
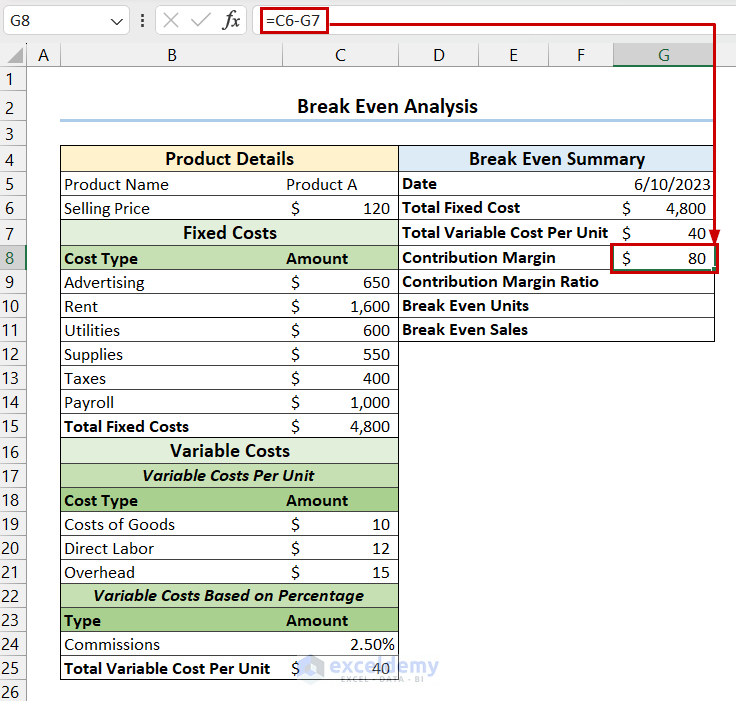
- Select the cell where you want the Contribution Margin >> write the following formula.
=C6-G7- Press Enter.
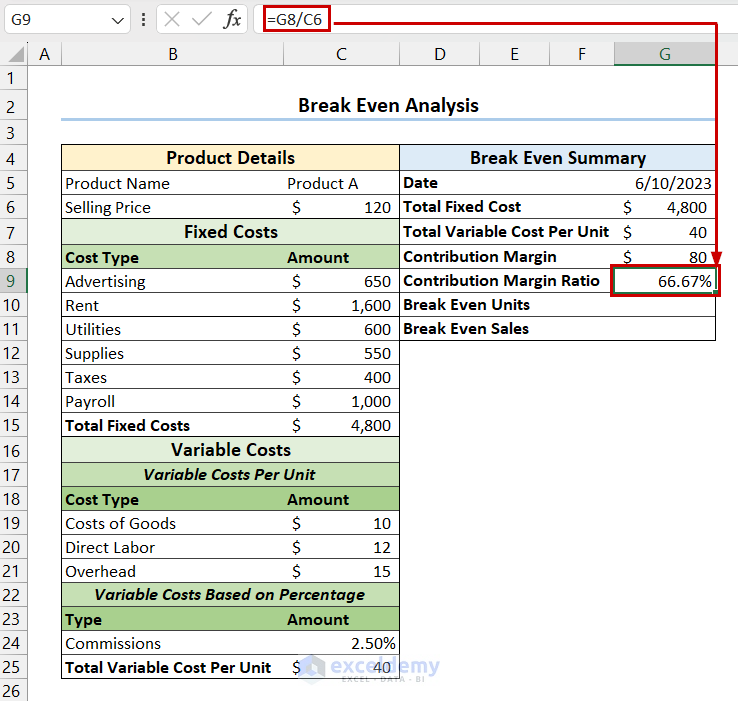
- Select the cell where you want the Contribution Margin Ratio >> write the following formula.
=G8/C6- Press Enter.
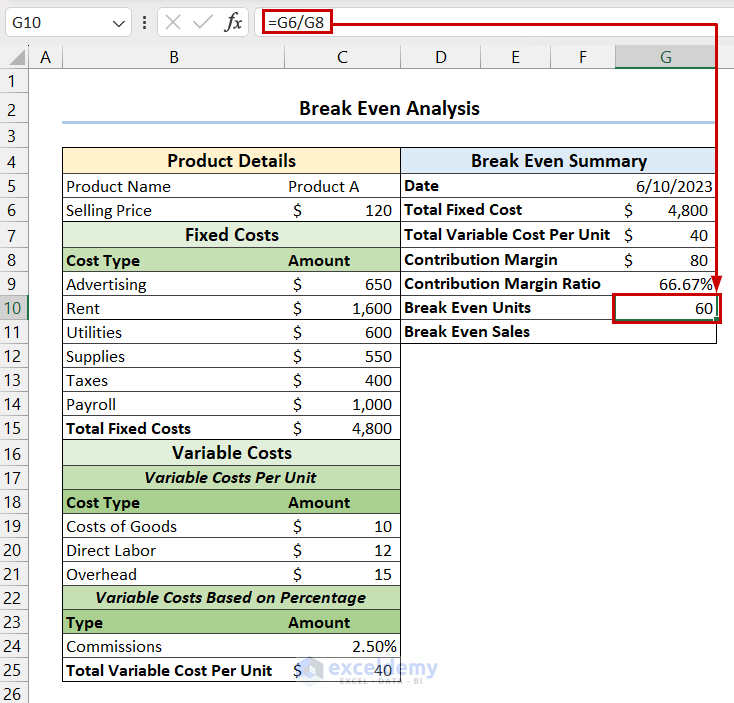
- Select the cell where you want the Break-Even Units >> write the following formula.
=G6/G8- Press Enter.
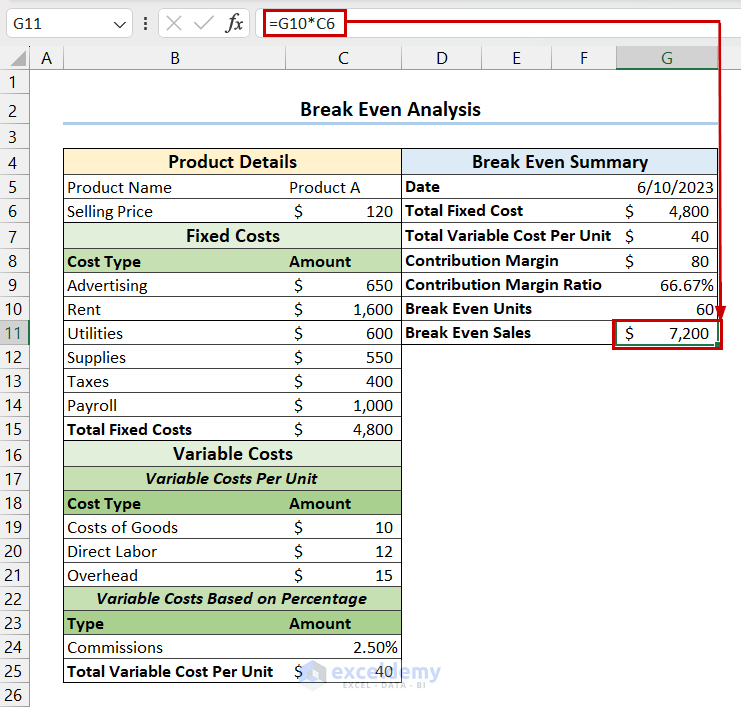
- Select the cell where you want the Break-Even Sales >> write the following formula.
=G10*C6- Press Enter.
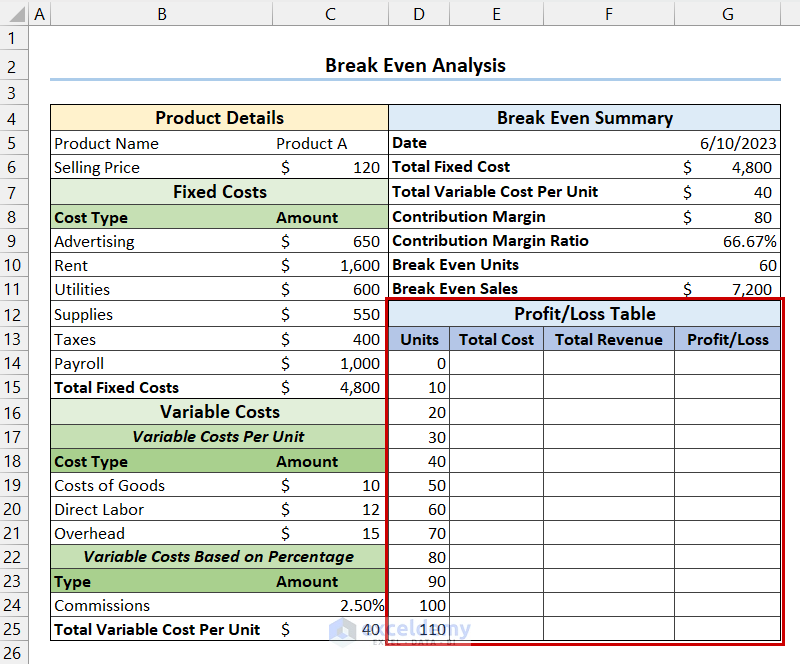
Step-05: Create Profit/Loss Table
- Create a table for Profit/Loss.
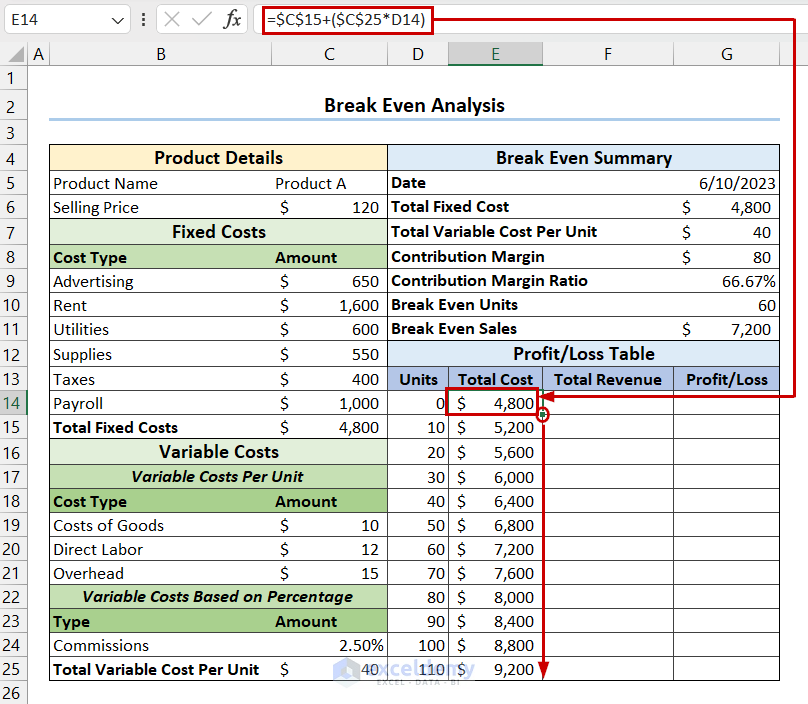
- Select the cell where you want the Total Cost >> write the following formula.
=$C$15+($C$25*D14)- Press Enter >> drag the Fill Handle to copy the formula.
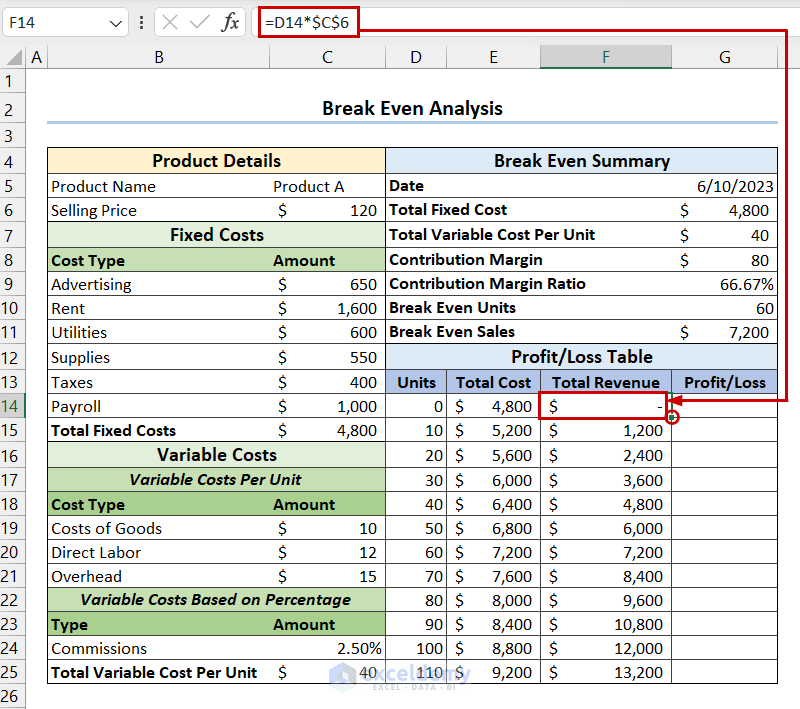
- Select the cell where you want the Total Revenue >> write the following formula.
=D14*$C$6- Press Enter >> drag the Fill Handle to copy the formula.
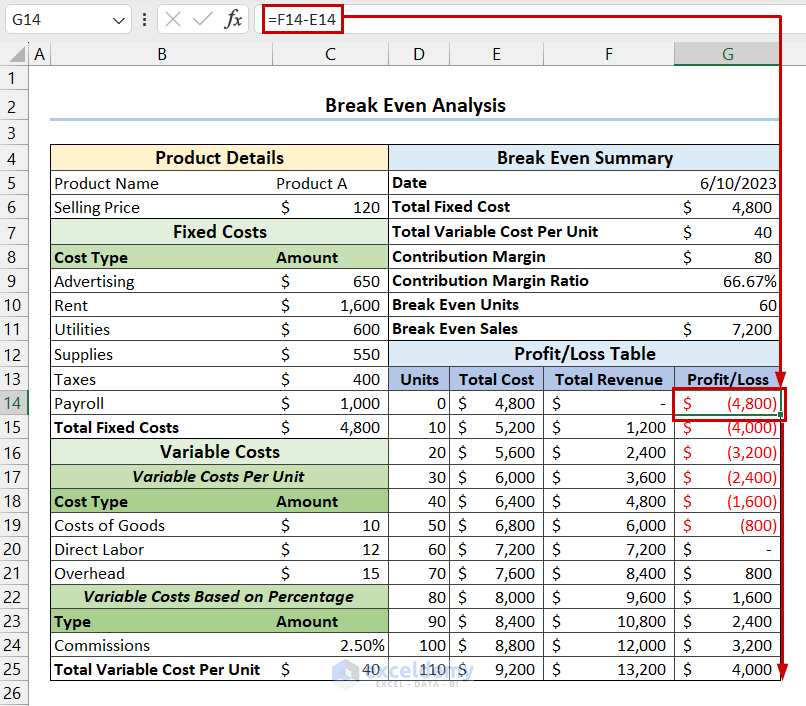
- Select the cell where you want the Profit/Loss >> write the following formula.
=F14-E14- Press Enter >> drag the Fill Handle to copy the formula.
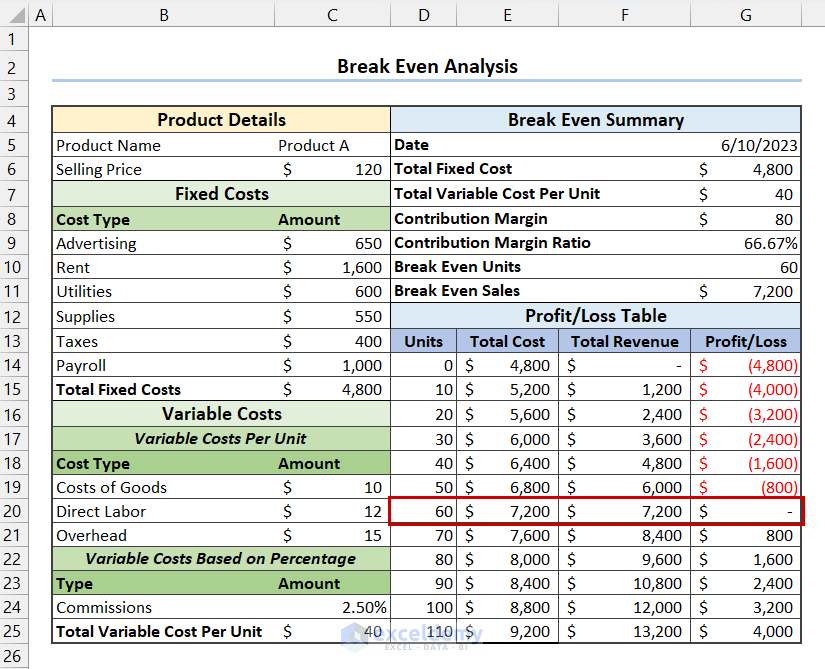
Step-06: Final Output
- In the following image, you can see the final break-even analysis template.
Things to Remember
- You must include all kinds of costs in the break-even analysis.
- At the break-even point, there is no profit or loss.
Conclusion
In the end, we can say that this article covers almost everything there is to know about break-even analysis in Excel. I hope you will find this article helpful. If you have any queries or any suggestions you want to share, feel free to comment in the comment section below.
Break Even Analysis in Excel: Knowledge Hub
- How to Calculate Break Even Sales with Formula in Excel
- Mortgage Break-Even Analysis in Excel
- How to Calculate Break Even Point in Excel
- How to Do Multi Product Break Even Analysis in Excel
- How to Do Break Even Analysis with Goal Seek in Excel
- How to Do NPV Break Even Analysis in Excel
- How to Make a Break-Even Chart in Excel
- How to Calculate Break Even Analysis with Formula in Excel
<< Go Back To Excel For Finance | Learn Excel

