In this Excel tutorial, you will find ways to calculate Standard Deviation using different arithmetic formulas in Excel. Here, we’ll discuss how you can calculate both Sample Standard Deviation and Population Standard Deviation. To calculate Sample Standard Deviation you can use the STDEV, STDEV.S or STDEVA function and for Population Standard Deviation use the STDEVP, STDEV.P or STDEVPA function. In addition, you can also learn how to calculate Mean and Standard Error in Excel from this article.
Here, we’ll use Microsoft 365 in this article.
Calculating deviation in Excel will give you an idea about how the data points are spread around a reference point. It will help you to make predictions of certain results and estimate the consistency of the data.

Download Practice Workbook
What Is Deviation?
Deviation is the difference between an observed or measured value and a reference or expected value. In statistics, there are a few common types of deviation. Standard deviation is one of them.
Standard deviation is a measure of how spread out the values in a dataset are around the mean (average).
What Is Sample and Population Standard Deviation?
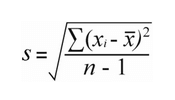
Sample Standard Deviation: When you are calculating the standard deviation of a sample from the whole population it is called Sample Standard Deviation. It includes only a subset of the total data points.
The formula to calculate Sample Standard Deviation:
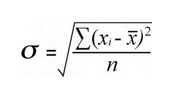
Population Standard Deviation: When you are calculating the standard deviation of the whole population it is called Population Standard Deviation. It includes the total data points of a dataset.
The formula to calculate Population Standard Deviation:
Where Do We Use Standard Deviation?
Standard deviation is a helpful tool used in many areas. It is commonly used in statistics to analyze and describe the spread of data points around the mean, providing knowledge about the consistency or variability of a dataset. Standard deviation is also used in finance and investment analysis to measure risk or volatility, helping investors estimate the potential variability of returns.
How to Calculate Standard Deviation in Excel?
There are different Excel functions such as STDEV, STDEV.S, STDEVP etc. functions using which you can calculate the standard deviation.
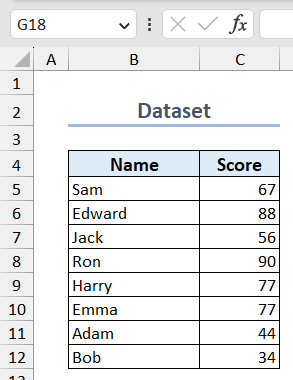
Here, we have a dataset containing the names and scores of some students. Now, we’ll show you how to calculate the sample and population standard deviation of these scores in Excel.
1. Calculate Sample Standard Deviation
You can use STDEV, STDEV.S or STDVA functions to calculate sample standard deviation in Excel.
1.1 Using STDEV Function
Excel STDEV function is the oldest function that is available from Excel 2003 to 2019. It counts any numerical values or a text representation of numbers directly and counts only numbers in arrays and references. However, it ignores empty cells, logical values (TRUE/ FALSE), text, and error values.
You can use the following formula to calculate the sample standard deviation in your dataset.
=STDEV(C5:C12)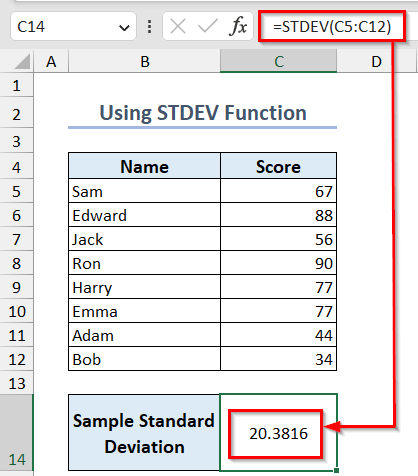
1.2 Applying STDEV.S Function
Excel STDEV.S function is the newer version of the STDEV function which is available from Excel 2010. While using Excel 2010 or newer versions use this function.
You can use the following formula in this regard and insert your own cell references.
=STDEV.S(C5:C12)
1.3 Using STDEVA Function
This function differs slightly from the previous two functions. It counts all logical values within an array. It counts any kind of text value (empty string, number representation) within the array or argument as 0.
Use the following formula to calculate the sample standard deviation in Excel.
=STDEVA(C5:C12)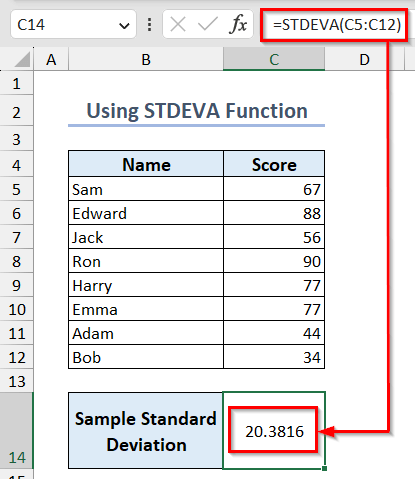
2. Get Population Standard Deviation
You can use STDEVP, STDEV.P or STDPA functions to calculate population standard deviation in Excel.
2.1 Using STDEVP Function
This function is the oldest function used to calculate population standard deviation in Excel.
You can use the following formula to use this function.
=STDEVP(C5:C12)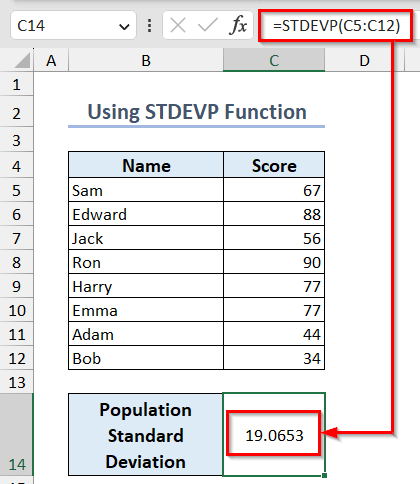
2.2 Inserting STDEV.P Function
Excel STDEV.P function is the modified version of the STDEVP function which is available from Excel 2010. While using Excel 2010 or newer versions use this function. These two functions also count any numerical values or a text representation of numbers directly and count only numbers in arrays and references. They ignore empty cells, logical values (TRUE/FALSE), text, and error values.
You can use the following formula to use this function in newer versions of Excel.
=STDEV.P(C5:C12)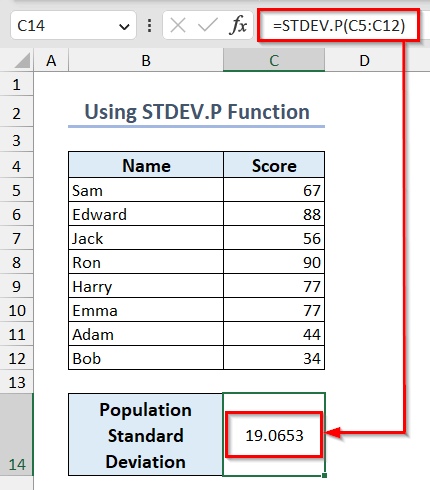
2.3 Applying STDEVPA Function
You can use the STDEVPA function to calculate the standard deviation of a population if you want to include text or logical values in your calculation.
Use the following formula to do that.
=STDEVPA(C5:C12)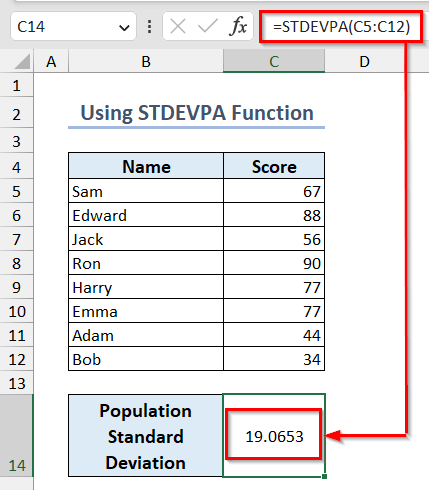
Read More: How to Calculate Deviation in Excel
How to Calculate Mean in Excel?
To calculate the mean of a distribution you can use the AVERAGE function in Excel. You can see an overview of this function below.

Click here to enlarge this image.
Use the following formula to calculate the mean of a distribution.
=AVERAGE(C5:C12)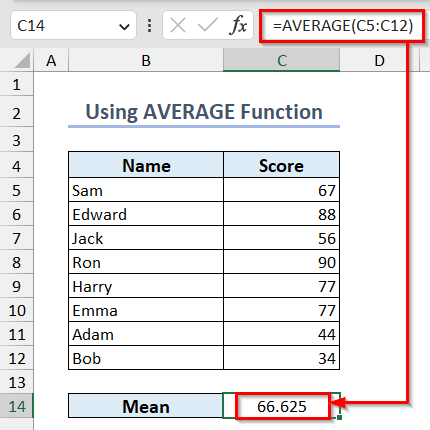
How to Calculate Standard Error in Excel?
The standard error tells how close the average of a sample is likely to be to the actual average of the whole group. To calculate the standard error of a distribution you can use the STDEV, SORT, and COUNT functions in Excel.
You can see an overview of the COUNT function below.

Click here to enlarge this image
Here is the formula which you can use to calculate standard error in Excel.
=STDEV(C5:C12)/SORT(COUNT(C5:C12))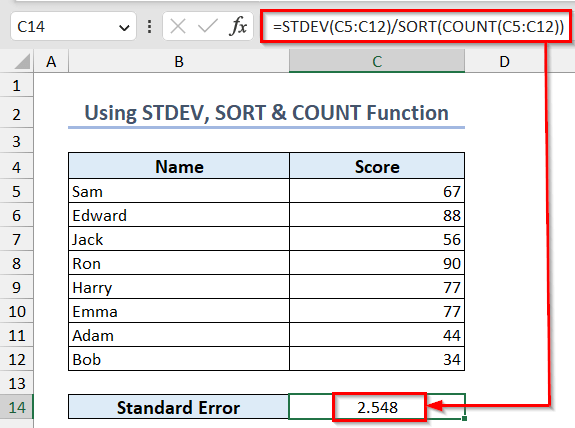
Read More: How to Calculate Absolute Deviation in Excel
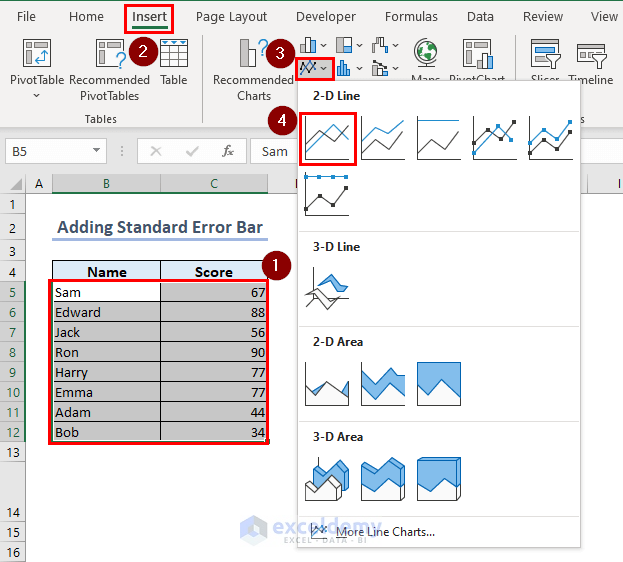
How to Add Standard Error Bars in Excel?
You can add standard error bars to your Excel chart from Chart Elements option.
- To create a chart, select your dataset.
- Go to the Insert tab >> click on Insert Line Chart >> select 2-D Line chart.
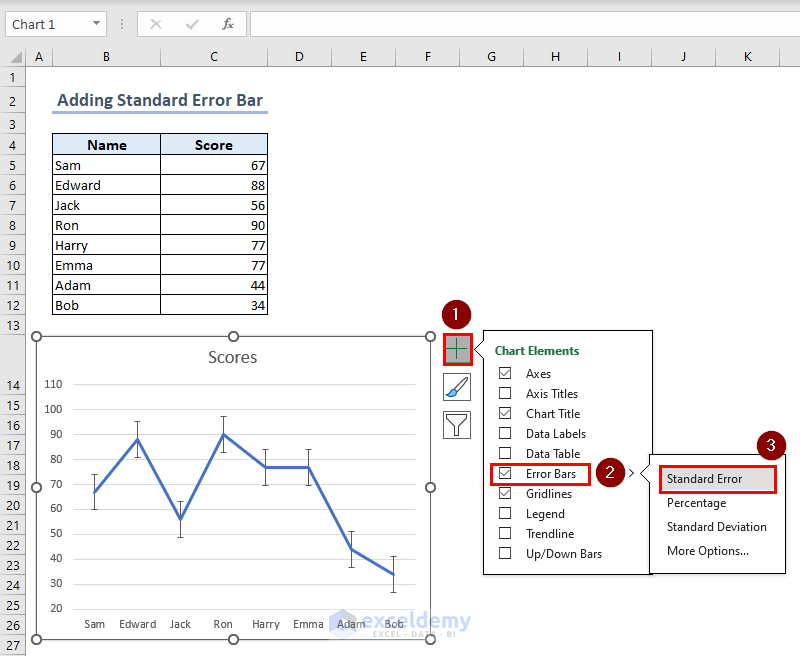
- Then, to add standard error bars, click on “+” sign >> turn on Error Bars option >> select Standard Error.
Click here to enlarge this image.
Which Things Should You Remember?
You must insert two numerical values as the function argument to calculate the sample standard deviation. Otherwise, it will return #DIV/0! error.
Frequently Asked Questions
1. What is the difference between STDEV.S and STDEV.P functions in Excel?
You can use the STDEV.S function when you want to calculate the standard deviation of a sample from the whole population. On the other hand, use the STDEV.P function if you want to calculate the standard deviation of the whole population.
2. How can I interpret the Standard Deviation value in Excel?
Standard deviation means how much the data points are dispersed from the mean or average. When the standard deviation value is high, the values are more dispersed. If the value of the standard deviation is low, it means the data points are closely clustered around the mean.
3. What is the difference between Standard Deviation and Standard Error?
Standard Deviation tells you about the spread of individual data points within a dataset. On the other hand, the Standard Error tells you how reliable your sample mean is as an estimate of the true population mean.
Conclusion
In conclusion, the article gives you a comprehensive guide to calculating various types of deviation in Excel. Here we’ve specifically discussed how you can calculate both Sample and Population Standard Deviation using different functions suitable for different Excel versions. Also, we’ve shown ways to calculate the mean and standard error of a distribution. Hope you find this article helpful and informative.
Deviation in Excel: Knowledge Hub
<< Go Back to Excel for Statistics | Learn Excel

