Calculating percentage change in Excel is a basic yet crucial task. It involves determining the relative difference between two values using Microsoft Excel. Let’s dive straight into this practical aspect of data analysis without glorifying the tool itself.
What Is Percentage Change in Excel?
Percentage change in Excel refers to the calculation of the relative difference between two values, expressed as a percentage. It is a straightforward way to measure the increase or decrease from an initial value to a final value. The formula for percentage change in Excel is:
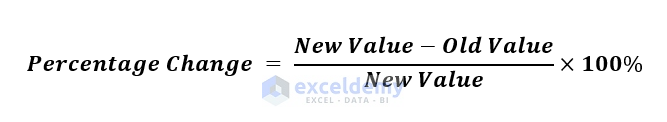
This formula provides a percentage that represents the magnitude and direction of the change. A positive percentage indicates an increase, while a negative percentage signifies a decrease. This function is commonly used in financial analysis, data interpretation, and various other fields to assess the significance of changes between two data points.
How to Calculate Percentage Change in Excel
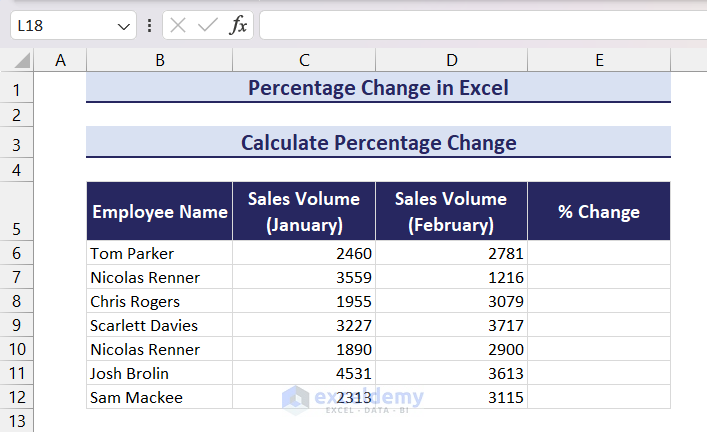
Consider the following dataset. We have a list of employees and their achieved sales volume for two consecutive months. We want to calculate the percentage change in sales volume for these employees.
In cell E6, apply the following formula => press the Enter key => drag down the Fill Handle icon to calculate the percentage change for all employees.
=(D6-C6)/C6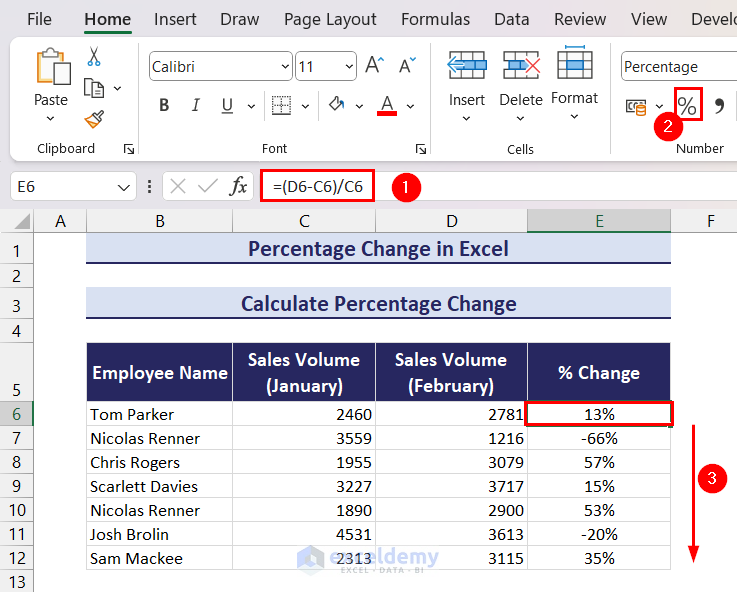
Some Real-World Examples of Calculating Percentage Change
Calculating percentage change is very common in real-world scenarios. It provides us with an idea of how various parameters in our lives are changing. Here are some common examples:
Price Appreciation in Investments:
Imagine you invested in a stock last month, and since then, its value has grown by 20%. This percentage change represents the positive shift in your investment, signaling an increase in its market value.
Rising Cost of Living:
In the context of everyday life, if the cost of goods and services was affordable last year and has since increased by 10%, it means you’re experiencing a rise in the overall cost of living.
Business Expansion and Success:
Picture a small business that achieved $100,000 in sales last quarter and has now reached $120,000. This 20% increase portrays the positive momentum and growth of the business.
Urban Development and Vibrancy:
Consider a city that had 500,000 residents five years ago and has witnessed a 10% increase in population. This growth signifies the evolving dynamics and vibrancy of urban life.
Educational Progress:
Envision a student who scored 75 out of 100 in the first exam and improved to 90 out of 100 in the second exam. This 20% advancement reflects the student’s commendable progress in their academic journey.
This concludes our article on how to calculate percentage change in excel. Along with the percentage change formula, we also discussed some real-world scenarios where we need to calculate percentage change. We hope this article was helpful to you. Let us know your feedback in the comment section.
Percentage Change in Excel: Knowledge Hub
- Calculate Average Percentage Change
- Calculate Percentage Increase Between Three Numbers
- Calculate Percentage Difference Between Two Numbers
- Percentage Difference Between Two Percentages
- Calculate Year over Year Percentage Change
- Calculate Percentage Change with Negative Numbers
- Show Percentage Change in Excel Graph
<< Go Back to Calculating Percentages | Calculate in Excel | Learn Excel

