All the combinations of products and services that a customer may buy at the current price range while staying within the limits of his or her available budget are represented by a budget constraint. In this article, we are going to demonstrate the step-by-step procedure to make a budget constraint graph on Excel. If you are also curious about it, download our practice workbook and follow us.
Introduction to Budget Constraints
The term Budget Constraint refers to all the combinations of products and services that a customer may buy at current pricing while staying within the limits of his or her available budget. This constraint prevents a consumer from buying a particular product in a large amount and helps to check the product’s purchasing feasibility when buying multiple types of products.
Let’s assume we want to buy two different amounts of products A and B. The price of product A is x and product B is y. Our amount of budget is C. So, the general equation of budget constraint will be:
Ax + By ≤ C
How to Make a Budget Constraint Graph on Excel: Step-by-Step Procedures
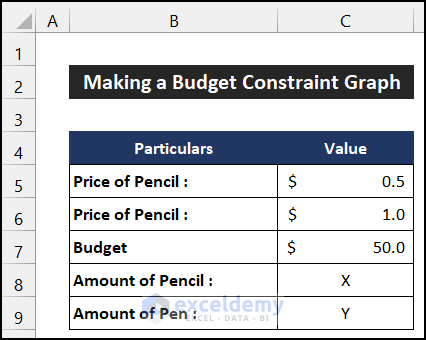
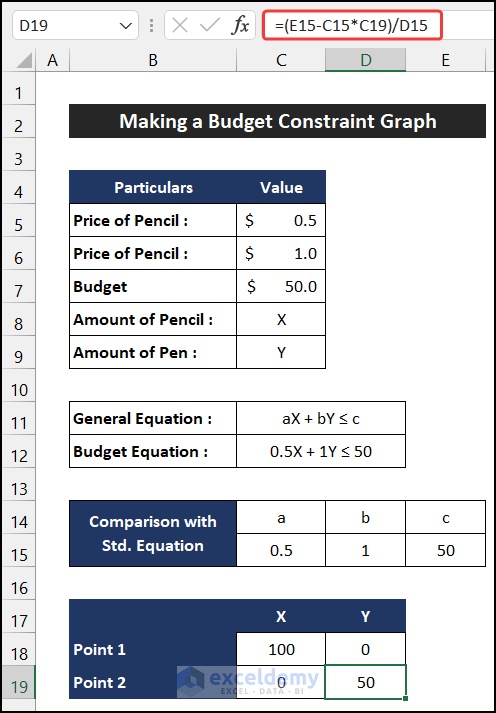
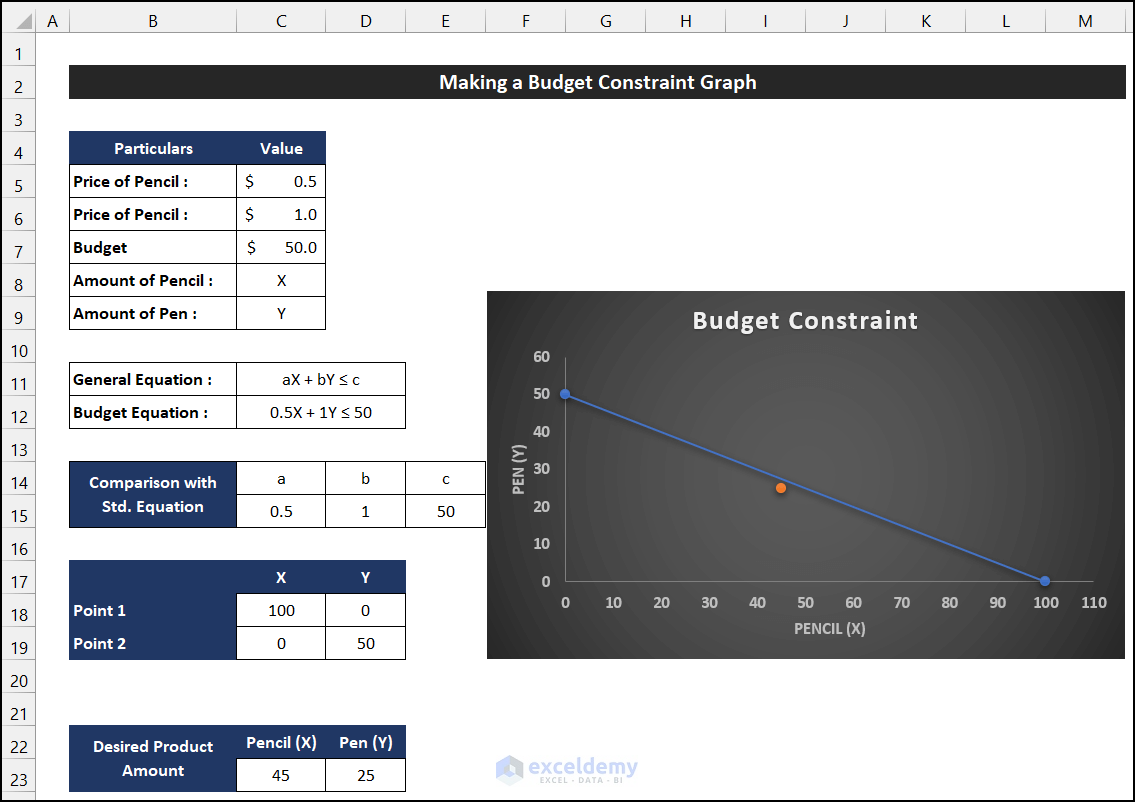
To demonstrate the procedure, we presume that we have a budget of $50 and we have to purchase some pens and pencils. The price of each pen will cost $1, and each pencil will be $0.5. This dataset is shown in the range of cells B5:C7.

📚 Note:
All the operations of this article are accomplished by using the Microsoft Office 365 application.
Step 1: Establishing Budget Equation
In the first step, we have to build our budget equation. This equation will look like the equation we have shown earlier. The procedure is explained below:
- First of all, we have to define two quantity variables for pour products. Let’s take the number of pencils as X and the number of pens as Y in the range of cells B8:C9.
- After that, write down the budget equation in cell C12 with the help of the general equation shown in cell C11.
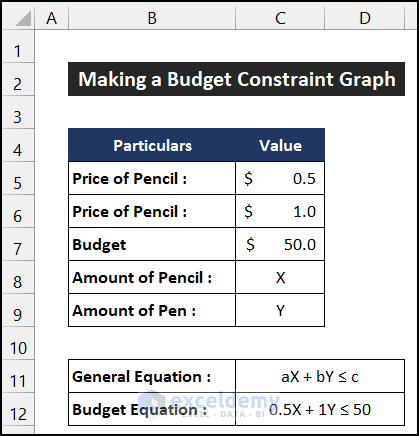
- Our first job is completed.
Thus, we can say that we have finished the first job of making a budget constraint graph on Excel.
Step 2: Estimation of Constraint Points
In this step, we will evaluate the constraint point to make the budget constraint graph. The process is described below:
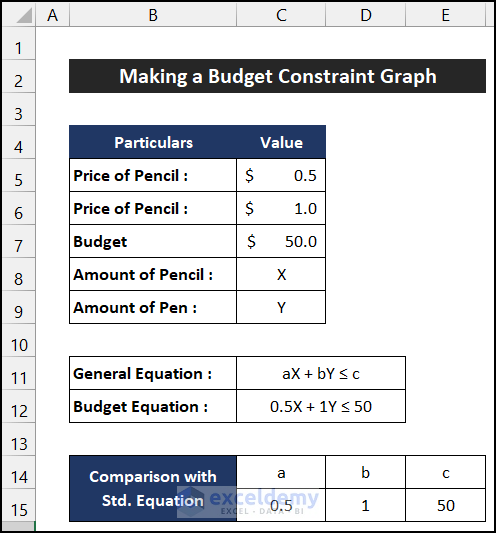
- First, compare our budget equation with the general budget equation, and note down the value of a, b, and c.
- Here, we write down the value of a, b, and c in the range of cells C14:E15.
- Now, we will calculate the constraint points of the budget constraint graph. Here, two possible cases can occur. Either we can use all of our money to buy only pencils, or we can use the budget to purchase pens. So, these two points will be the constraint points.
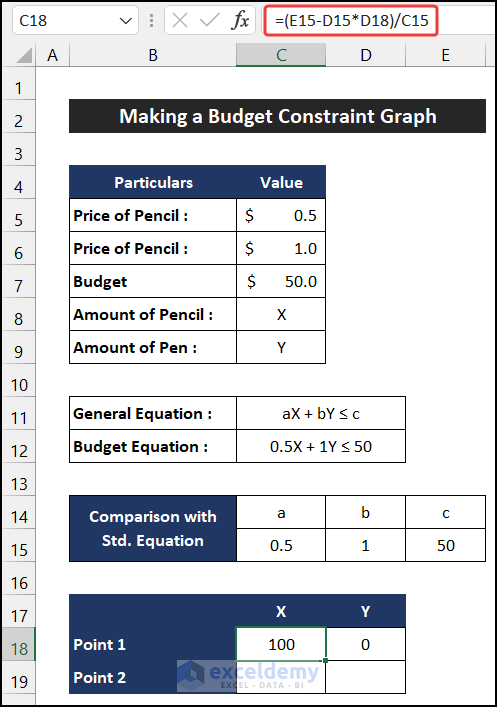
- If we buy only pencils, the value of Y will be 0. So, select cell D18 and write down 0 in that cell.

- Then, to get the maximum number of pencils that we can purchase by this budget, write down the following formula in cell C18.
=(E15-D15*D18)/C15
- Press Enter.
- Similarly, if we buy only pens, the value of X will be 0.
- Now, select cell C19 and write down 0 into the cell.

- Afterward, select cell D19 and write down the following formula in the cell.
=(E15-C15*C19)/D15
- Again, press Enter.
- You will get the constraint points.
Hence, we can say that we have completed the second job to make a budget constraint graph on Excel.
Step 3: Inserting Budget Constraint Graph
In the following step, we are going to insert the budget constraint graph in our Excel spreadsheet. The procedure is shown below:
- At first, select the range of cells C18:D19.
- Now, in the Insert tab, click on the drop-down arrow of the Insert Scatter (X, Y) or Bubble Chart from the Charts group and choose the Scatter with Stright Lins and Markers from the Scatter section.
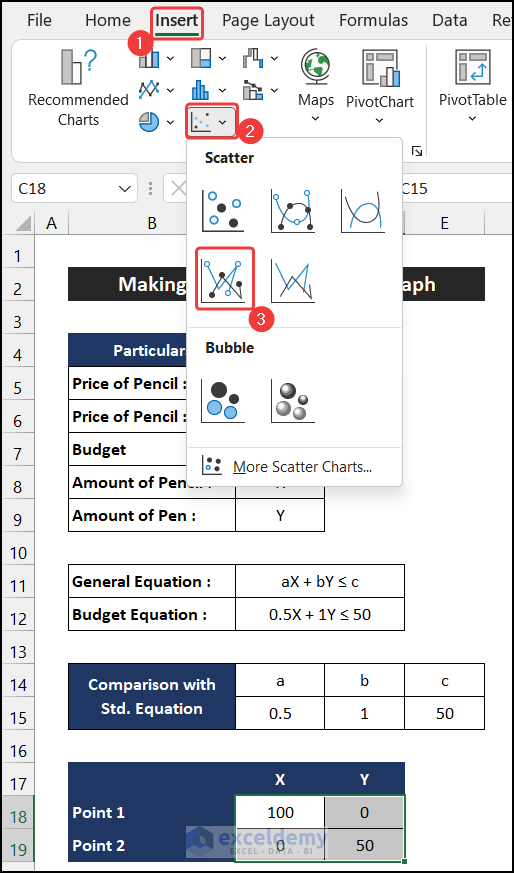
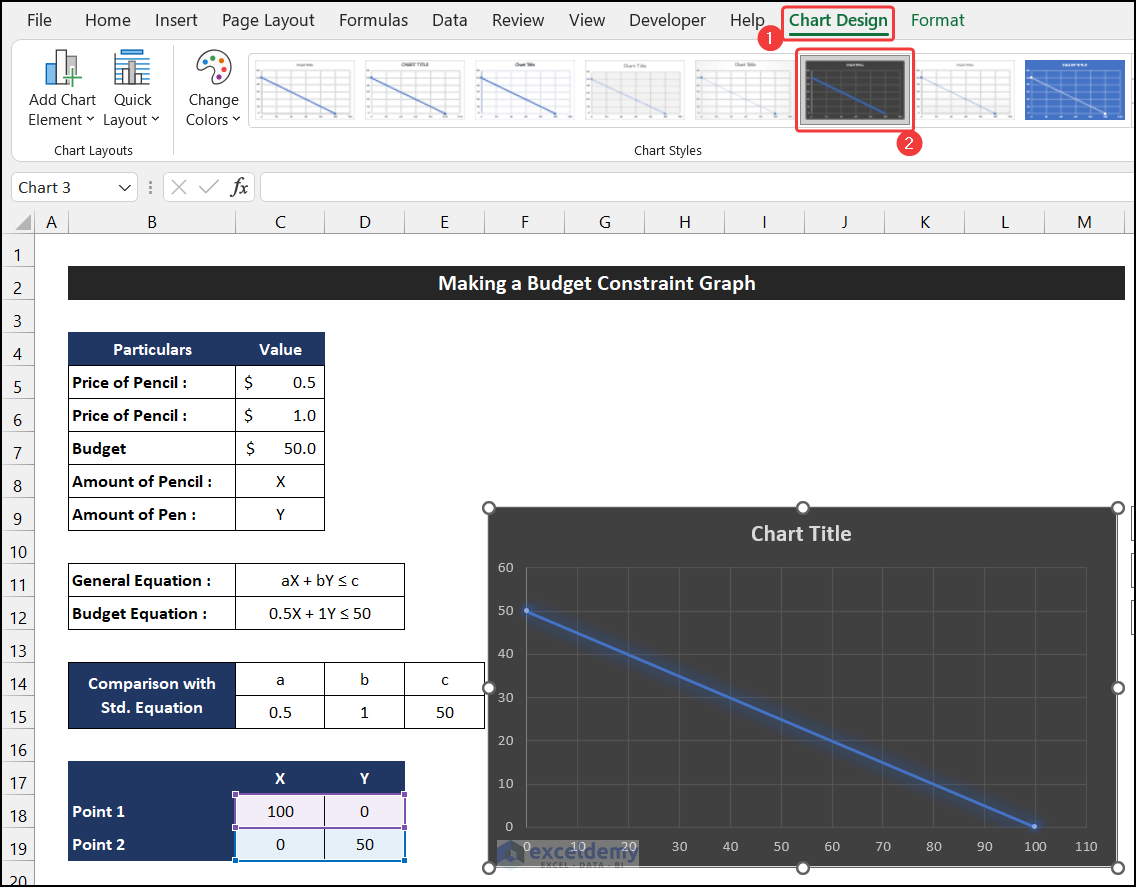
- The chart will appear in front of you.

- Now, modify the chart according to your desire. For our chart, we chose the Style 8 option from the Chart Styles group, located in the Chart Design tab.
- Besides that, we uncheck all the chart elements except the Axes, Axis, and Chart Title options.
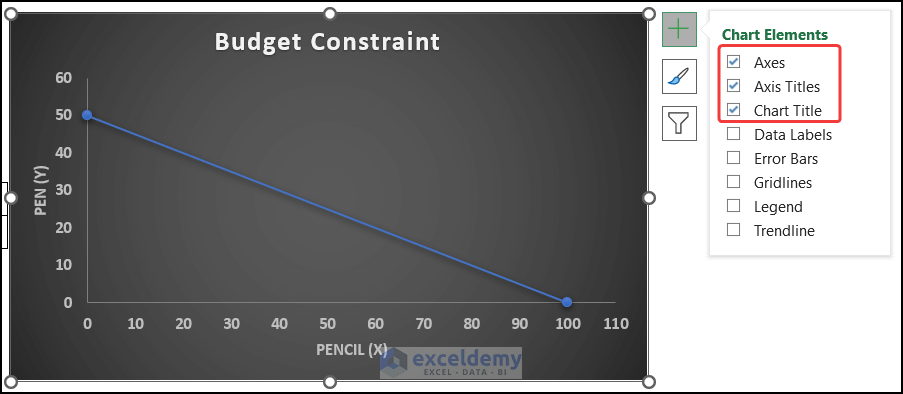
- Our graph insertion task is finished.
Therefore, we can say that we have accomplished the final job to make a budget constraint graph on Excel.
Read More: How to Create Mekko/Marimekko Chart in Excel
Step 4: Check Feasibility with Sample Data
In this step, we are going to check the feasibility of our desired amount to check whether we can afford it. The process is given as follows:
- Firstly, write down your desired amounts in the range of cells C23:D23.

- Now, in the Chart Design tab, click on the Select Data option from the Data option.
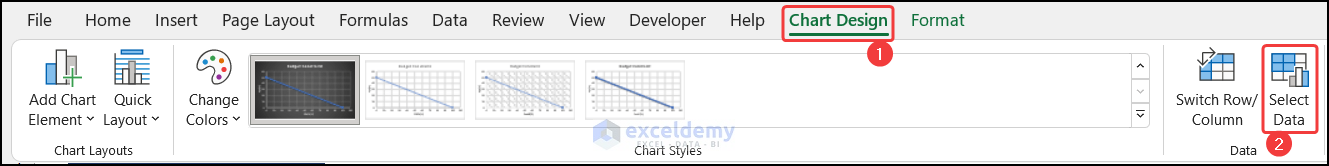
- As a result, a small dialog box called Select Data Source will appear.
- After that, in the dialog box, select the Add option.

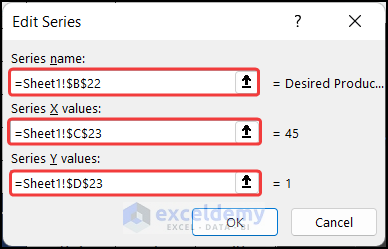
- Another dialog box called Edit Series will appear.
- Then, input this series according to the image shown below.
- Finally, click OK.
- Again, click OK to close the Select Data Source dialog box.

- Now, you can input the quality according to your desire and check whether that quantity can afford within that amount.
Finally, we can say our all of our formulas and procedures work properly, and we are able to make a budget constraint graph in Excel.
Download Practice Workbook
Download this practice workbook for practice while you are reading this article.
Conclusion
That’s the end of this article. I hope that this article will be helpful for you and you will be able to make a budget constraint graph in Excel. Please share any further queries or recommendations with us in the comments section below if you have any further questions or recommendations.
Don’t forget to check our website for several Excel-related problems and solutions. Keep learning new methods and keep growing!
Related Articles
- How to Create a Weight Loss Graph in Excel
- How to Create Activity Relationship Chart in Excel
- How to Find Intersection of Two Curves in Excel
- How to Show Intersection Point in Excel Graph
<< Go Back to Excel Charts | Learn Excel

