The SKEW function in Excel calculates the skewness of a range of data. The skewness is the deviation of the normal distribution which is a fundamental topic of statistics. In this article, you will learn to use the SKEW function in Excel with 2 suitable examples of it.
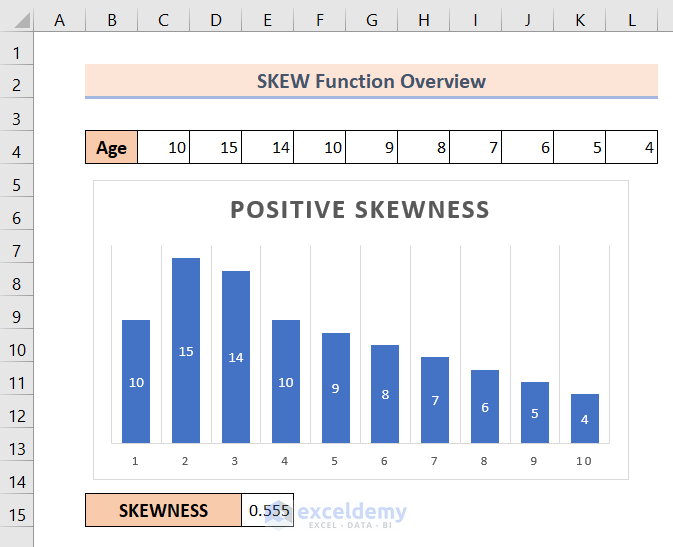
The above screenshot is an overview of the article, representing a few applications of the SKEW function in Excel. You’ll learn more about the methods along with the other functions to use the SKEW function precisely in the following sections of this article.
SKEW Function in Excel: Syntax
- Function Objective:
The SKEW function calculates the skewness of a range of data in Excel.
- Syntax:
SKEW(number1, [number2], …)
- Arguments Explanation:
| Argument | Required/Optional | Explanation |
|---|---|---|
| number1 | Required | A range of numbers for which you want to calculate the skewness. |
| number2 | Optional | A range of numbers for which you want to calculate the skewness. |
- Return Parameter:
Returns either positive or negative value of the skewness.
What is Skewness in Statistics?
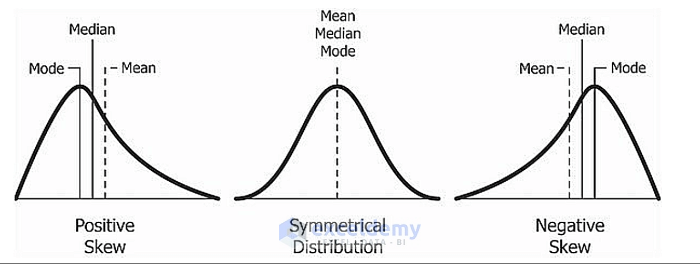
The skewness is the asymmetry of an ideal symmetric probability distribution which we also know as poison’s distribution curve. It is a fundamental concept of statistics. The poison’s distribution curve which is also known as the normal distribution has a skewness of 0. This means the normal distribution curve is perfectly symmetrical.
Though no practical probability distribution is perfectly symmetrical. But they have a skewness that tends towards zero.
In the picture below, the curve in the middle that is symmetrical distribution is the ideal curve which is also called the normal distribution curve.
Any deviation from the normal distribution possesses some values of skewness. Based on the skewness value, the skewness can be of two types. Which are:
1. Positive Skewness
2. Negative Skewness
 You will learn more about the types of skewness in the following sections. Based on the skewness value, the skewness can be of two types. Fortunately, the SKEW function in Excel can handle both of them. So without having any further discussion let’s learn them one by one.
1. Using Excel SKEW Function to Calculate Positive Skewness
When the hump of the normal distribution is located on the left side of the center and the tail is on the right side, then it is called positive skewness. In such cased the skew value is positive.
We have a list of ages for which we plotted a graph. From the graph, it is clearly visible that the hump of the distribution is on the left side of the center and the tail is on the right side.
Now let’s calculate the skew values using the SKEW function in Excel. To see the skew value,
❶ First of all select cell E15. In this cell, we will insert the SKEW function.
❷ Then insert the formula with the SKEW function.
=SKEW(C4:L4)❸ Now press the ENTER button.
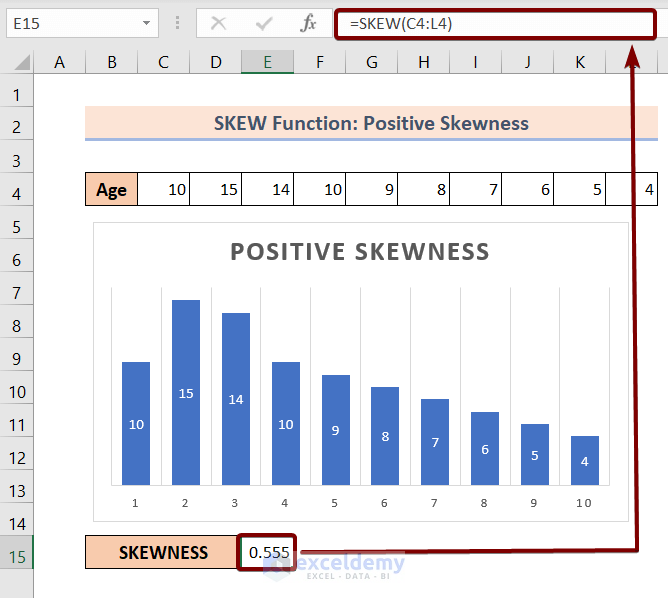
From the formula result, the value of the skewness is 0.555 which is positively skewed. We also can see from the graph that the asymmetry of the normal distribution has been shifted to the left of the center.
Read More: How to Calculate Coefficient of Skewness in Excel
2. Applying SKEW Function in Excel to Calculate Negative Skewness
When the hump of the normal distribution curve is shifted to the right then it is called a negatively skewed normal distribution.
Let’s again consider a range of ages for which we will plot a graph. As we plot the graph we can see that the tail of the graph is on the left side of the center.
Now let’s validate the graph by calculating the skewness using the SKEW function.
❶ First of all select cell E15 to store the formula result.
❷ After that enter the formula with the SKEW function.
=SKEW(C4:L4)❸ Finally hit the ENTER button.
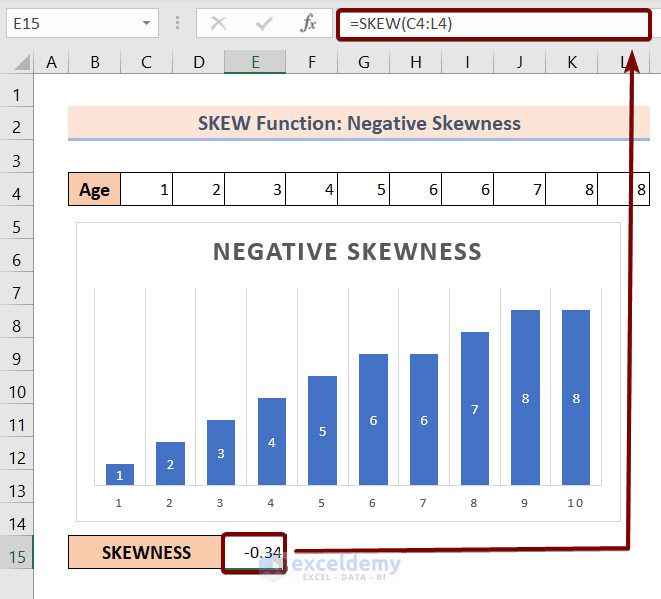
Now from the formula result, it is visible that the skewness has a negative value of -0.34. This also supports the graph as the hump of the graph is shifted to the right of the center than a normal distribution curve.
Things to Remember
📌 The SKEW function supports a maximum of 255 arguments in its argument list.
Download Practice Workbook
Download the Excel file and practice along with it.
Conclusion
To sum up, we have discussed the usage of the Excel SKEW function with 2 suitable examples. You are recommended to download the practice workbook attached along with this article and practice all the methods with that. And don’t hesitate to ask any questions in the comment section below. We will try to respond to all the relevant queries asap.
Related Article
<< Go Back to Excel Functions | Learn Excel


Is there a VBA function that calculate probability of area left to a Z score in skewed distribution if given Z score, Mean, Std dev, Skewness, Kurtosis. Eg Probability(Z,Mean,Stddev,Skew,Kurtosis)
Norm.dist(Z,Mean,Std Dev) is function to calculate probability of Normal Distribution.
Hello Mr. Mejon,
Unfortunately, there is no VBA function that calculates the probability of area left to a Z score in a skewed distribution.
However, I’m suggesting you some functions that might help you.
Z.TEST function >>> Returns the one-tailed probability-value of a z-test.
KURT function >>> Returns the kurtosis of a data set.
GAUSS function >>> Returns 0.5 less than the standard normal cumulative distribution.
F.DIST.RT function >>> Returns the F probability distribution.
SKEW.P function >>> Returns the skewness of a distribution based on a population: characterization of the degree of asymmetry of a distribution around its mean.
Regards!