Are you looking for an Excel function that will return the standard deviation of the entire population and also match the given criteria? In this case, the DSTDEVP function is the best possible option. The DSTDEVP function is an Excel statistical function that calculates the standard deviation of a sample of data that is arranged in a column or row and matches the conditions that you specify. In this article, I will give you an overview of the DSTDEVP function along with two practical examples.
What Is Standard Deviation?
The standard deviation is a statistical measure that describes the amount of variation or dispersion in a dataset. It measures how much the individual data points deviate from the mean of the dataset.
In other words, the standard deviation indicates how much the data points are spread out from the average value. If the standard deviation is high, it means that the data points are more spread out from the mean, indicating a higher degree of variability or diversity in the data. Conversely, if the standard deviation is low, it means that the data points are closer to the mean, indicating a lower degree of variability or diversity in the data.
The formula to calculate the standard deviation is:
Where:
- SD is the standard deviation
- Σ is the sum of
- xi is the value of the ith data point
- x̄ is the mean of the data set
- n is the number of data points in the data set.
The square root of the sum of the squared differences between each data point and the mean divided by the number of data points minus one.
Introduction to DSTDEVP Function in Excel
Objective
Determines the standard deviation of a population based on the entire population by using the number or name of the heading in a column of the dataset that matches the conditions that are mentioned.
Syntax
Arguments Explanation
| Argument | Requirement | Description |
|---|---|---|
| dataset | required | The range of the cells that complete the dataset. |
| field | required | Indicates which column is used in the function. Enter the column label enclosed between double quotation marks, such as “Population” or a number (without quotation marks) that represents the position of the column within the list: 1 for the first column, 2 for the second column, and so on. |
| criteria | required | The range of cells that contains the conditions that you specify. You can use any range for the argument, as long as it includes at least one column label and at least one cell below column label in which you specify a condition for the column. |
Criteria Options
The criteria argument can recognize a variety of expressions. Following are some examples of how this argument behaves:
| Criteria | Action |
|---|---|
| >10 | greater then 10 |
| <>10 | not equal to 10 |
| 10 | is Equal to 10 |
| >5/5/2023 | greater than the date May 5,2023 |
| Asia | matches with “ASIA” or “asia” |
Versions
- We have used Microsoft Excel 365 Version.
DSTDEVP Function in Excel (Find Standard Deviation Using 2 Suitable Examples)
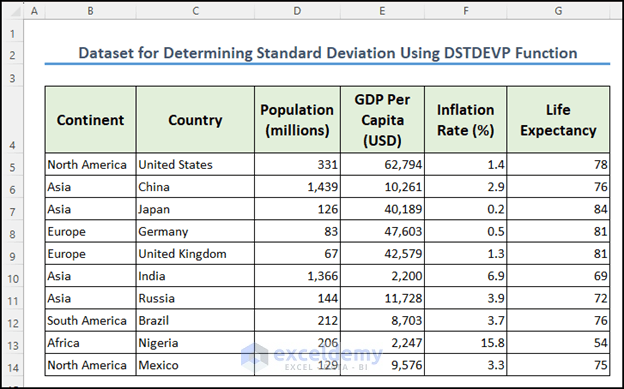
Here is a dataset of the Population of different countries. This dataset includes GDP Per Capita, Inflation Rate & Life Expectancy as well. I will use the DSTDEVP Function to determine the standard deviation based on some given criteria. I have given two examples here to describe the use of the DSTDEVP function.
Example 1: Calculate Standard Deviation of a Specific Criteria Using DSTDEVP Function in Excel
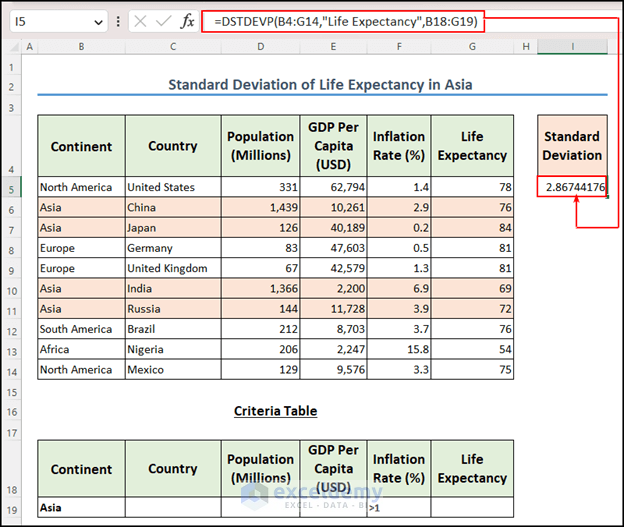
Suppose I want to calculate the standard deviation of the Life Expectancy only in the Asia Continent of the dataset but for the countries whose Inflation Rate is greater than 1%.
So this is the case where I need the standard deviation of a field for specific criteria. I can use the DSTDEVP function here to get my result.
The following are the steps:
- Write the formula in the I5
=DSTDEVP(B4:G14,"Life Expectancy",B18:G19)
- Next, press Enter to see the result.
- You got the standard deviation in the I5
Formula Breakdown
=DSTDEVP(B4:G14,”Life Expectancy”,B18:G19)
- Firstly, B4:G14 is the range of cells containing the range of the entire dataset.
- Next, “Life Expectancy” is the field or column name that identifies the data to be used in the calculation of standard deviation.
- Finally, B18:G19 is the range of cells containing the criteria or conditions that must be met in order for a data point to be included in the calculation. In this case, the criteria range specifies the Continent and Inflation Rate for which we want to calculate the standard deviation of the Life Expectancy
Example 2: Calculate Standard Deviation by Applying Criteria in Multiple Fields
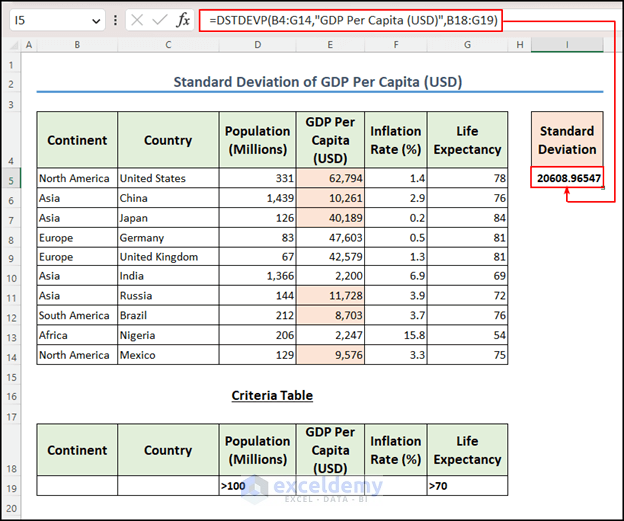
There may be a situation where you have to apply criteria across multiple fields. Here is an example of this. I want to calculate the standard deviation of the GDP Per Capita only for the countries that have more than 100 million people and whose Life Expectancy of those countries is greater than 70. To do this, follow the steps below:
- Enter the formula in cell I5.
=DSTDEVP(B4:G14,"GDP Per Capita (USD)",B18:G19)
- Then, hit the Enter
- As a result, you got the standard deviation of GDP Per Capita which is 96547 USD.
Formula Breakdown
=DSTDEVP(B4:G14,”GDP Per Capita (USD)”,B18:G19)
- B4:G14: This is the range of cells in the database that contain the data that you want to analyze.
- “GDP Per Capita (USD)”: This is the field or column header in the database for which you want to calculate the standard deviation.
- B18:G19: This is a range of cells that contains the criteria or conditions that you want to apply to the data in the database. In this case, the Population is >100 Million and the Life Expectancy is >70.
What Is the Difference Between DSTDEVP and DSTDEV Functions?
The main difference is that the DSTDEVP function calculates the standard deviation for the entire population, whereas the DSTDEV function calculates the standard deviation of a sample.
Now, what is the difference between the sample’s and the entire population’s standard deviation? The population standard deviation considers every individual in the dataset. Whereas, the sample standard deviation means considering some of the individuals in the dataset.
So, the DSTDEV function gives a higher value of standard deviation than the DSTDEVP function.
What Are the Database Functions in Excel?
Excel Database Functions are the type of functions by which SUM, Count, Standard Deviation, Variance, Average, etc. Basic operations can be done by using the entire dataset.
Some built-in database functions of Excel:
DAVERAGE function: Returns the average value of the selected database entries.
DCOUNT function: Counts the cells that have numbers in a dataset.
DCOUNTA function: Counts nonblank cells in a specific database.
DGET function: Extracts a single record that matches the specific criteria from a database.
DMAX function: Returns the maximum value from selected database entries.
DMIN function: Returns the minimum value from selected database values.
DPRODUCT function: Multiplies the values in a particular field of records that match the criteria in a database.
DSTDEV function: Calculates the standard deviation based on a sample of selected database values.
DSTDEVP function: Computes the standard deviation based on the entire population of selected database entries.
DSUM function: Sum up the numbers in the field column of records in the database that match the condition.
DVAR function: Estimates variance based on a sample of selected database entries.
DVARP function: Determines variance based on the entire population of selected database values.
Things to Remember
- The dataset column headings and the Criteria headings should be matched necessarily.
- When you need to determine the standard deviation for the entire population, use the DESTDEV Function.
- In the Criteria table, the DSTDEVP Function recognizes some wildcards.
- In the second argument, the field should be specified as a name inside a double quotation (“”) or as the field index number.
- The criteria table can contain multiple rows.
- The DSTDEVP function is not case-sensitive. In the field argument, you can use “age” or “Age”. Both will work.
Download Practice Workbook
You may download the following Excel workbook for better understanding and practice it by yourself.
Conclusion
I hope this article gave you a clear concept of the DSTDEVP function in Excel. I have tried to explain how to use the DSTDEVP function in Excel with two easy examples. If you follow this article carefully, you will be able to use this function wherever you need it while performing statistical analysis. Feel free to leave a comment in case you face any problems while using the DSTDEVP function.
<< Go Back to Excel Functions | Learn Excel

